Is October the month of stabilisation or destabilisation?
Last week’s market sentiments were evidently negative due to the rising cases in Singapore as well as the threatening outlook of US shutting down its federal government if they choose not to sign the bill or an extension. To be honest, it wasn’t news to anyone long enough in the game as there is a seemingly unlimited room for US to pile on its debt. Although warning signs are starting to appear, such as the dangerously high inflation rates (> 5%) that is set to last until 2022, no country trading internationally with USD will raise red flags when US continue to print more cash as it will also implicate their own currency. That said, are we going to henceforth see an ever rallying stock market and a stable global market? All of that remains to be seen but one can only expect that the number of people buying no matter how high is the price is obviously dwindling. Circling back to Singapore’s market, I guess we have ourselves to count on for growth but our market’s overall stability will inevitably depend on the rest of the major economies.
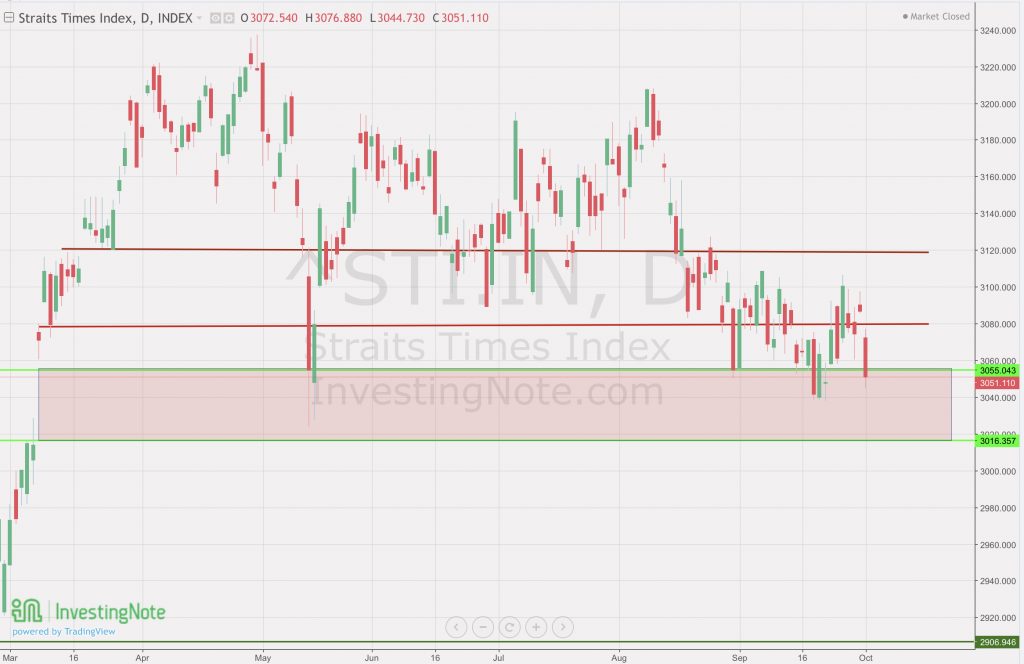
STI – Updated Daily Chart

The STI is back in the “void” and closing slightly below the upper limit of the gap which we have been watching at for a while now. Last week’s expectation was to see STI retest 3000 however, the index did remain resilient in the end. Although it is still premature to think that STI is out of the woods, the US did finish on another optimistic candle at market close on Friday. So at least for Monday, we should be expecting a green candle or a small gap up again like last week.
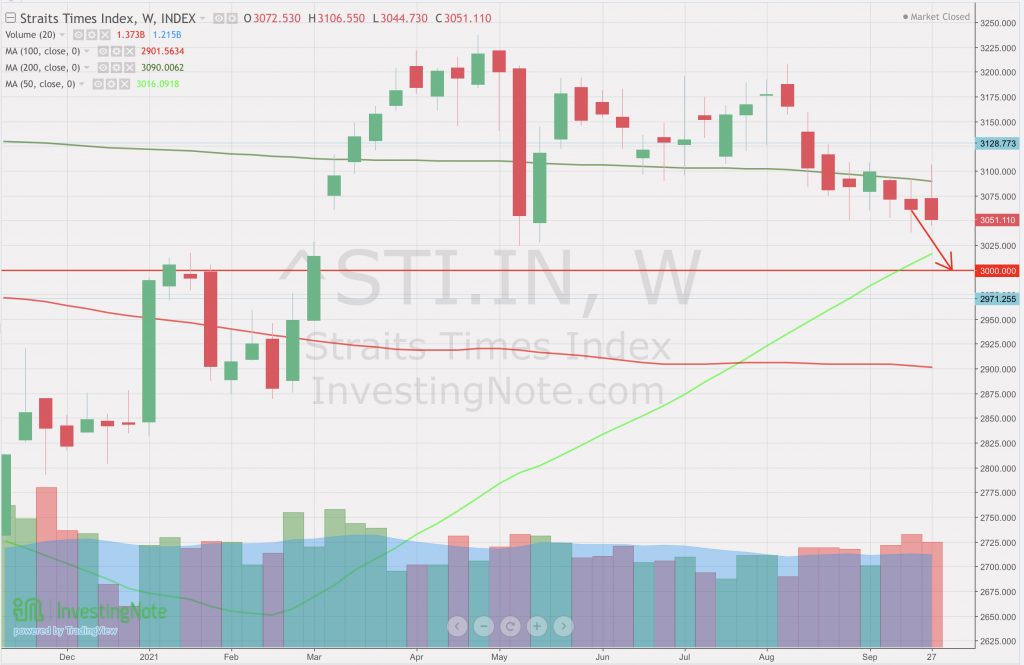
STI – Updated Weekly Chart

We are still trending lower when looking at the weekly chart but if you notice, the 50 weeks MA is still ascending and approaching around 3030 levels when the weekly candles eventually meet. Therefore I do expect a bounce or at least some support provided by the 50 weeks MA in the weeks to come.
Author’s Call as of 2nd October 2021
- The infection numbers are still on the rise but the MTF remains hopeful and are trying to keep our healthcare sector functioning adequately
- The daily chart looks seemingly resilient despite global instability due to US last minute approval of the bill extension
- STI’s weekly chart shows that the market is still trending lower but 50 weeks MA continue to ascend and might provide adequate or temporal support
- Overall STI continues to stay resilient and modest, winners goes to those who have been selling off in the past weeks as they will be able to buy back at a significant discount in the past week
- Moving forward, we need to careful when we accumulate as the market might get more volatile as the major economies address its debt issues
Author’s Call as of 25th September 2021
- Rolling back to 2 pax instead of 5 was supported by the rising daily cases and potential havok that might occur at the hospitals
- The daily chart shows resilience last week but might be retreating in the coming week back to 3000 level
- The weekly chart also shows similar signals that there is more pessimism in the market at the moment and we should be seeing more downside
- Recommendations to investors is to stay away from panic selling and focus on buying back if you have exited awhile back for a discounted reentry


