STI is still at its tipping point – Will it rise or fall?
With the whole world getting ready confused at the moment, STI continues to stay resilient. To be fair, we are in no way in the best position as the index failed to rise alongside global indexes in the past 2 years. Instead, we held our ground for the most part and just hover around the pre-pandemic time levels for the whole of 2021. Right now the optimism is led by the fact that we have done almost everything we could to prepare for the future ways of covid infections. For investors in the Singapore market, most of us are still waiting for institutions to push the index higher before we decide if we should hold or sell. Personally, I am taking on a less aggressive approach in trading for the time being and will wait for the index to reach its new stable state before revising my strategy. Otherwise, dividends are coming soon in the next couple of months so that should compensate for the vested capital.
STI – Updated Daily Chart


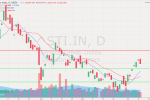
On the daily chart, I am prepping for the rally from 3290 to 3400 level in the coming weeks if all goes well. The CNY week will mute trades for sure but otherwise, we should also be seeing some reactions in the market as the US market is also at a make-or-break state at the moment.
STI – Updated Montly Chart

The monthly chart seems to be rather stable at the moment as we are still resting slightly above some resistant lines at around 3280. I added two more fine and dotted lines above the middle division line to signify the challenges ahead for the index but otherwise, we are still in a state where the future is fairly inconclusive.
Author’s Call as of 22nd January 2022
- The STI shows no sign of corrections yet although the US market has already retreated considerably in the past weeks
- Daily chart so far hovers above the resistance line but has not break out of it convincingly
- The STI’s monthly chart looks stable but mellow as there is little difference since last week.
- Investors should still look out for market reactions and see if institutions are coming back to the SG market
- More updates in the next STI market outlook with some fund flow analysis
Author’s Call as of 15th January 2022
- STI continues to stay bullish despite global volatility
- Daily chart shows that we are heading towards 3282 resistance
- Weekly chart also shows that we are heading towards 3290 resistance
- Advise to investors to keep their hopes at bay for a continued recovery but can still hold more of the depressed stocks in hope for a further rally when travel restrictions is reduced.


