Well STI fell and CNY is here
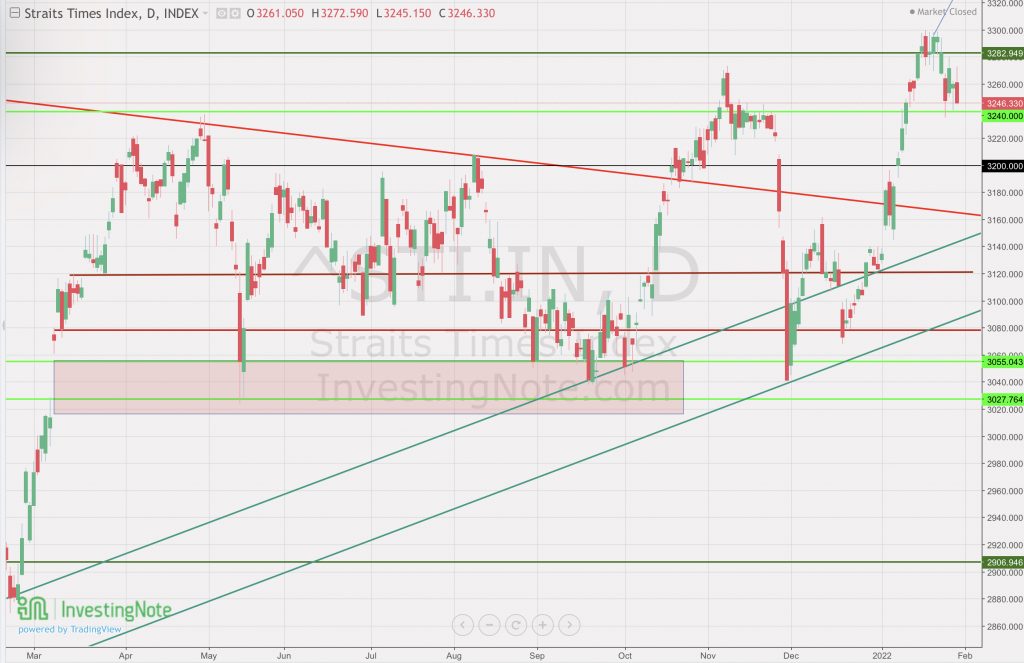
Following last week’s market outlook, the STI has now retreated back to the 3240 level because of the increased volatility of the global market. As most counters on STI are value and dividend stocks, we should be on the safer side for now so long as there are no bad news in the coming week about the pandemic. Looking at the correction of the US as well as Friday’s closing on the positive note, we will have to see how companies are going to keep institutional and retail investors money otherwise more selling is still possible. Whereas for Singapore, more buying is natural so long as our country continues to recover from the pandemic progressively with the right measures in place.
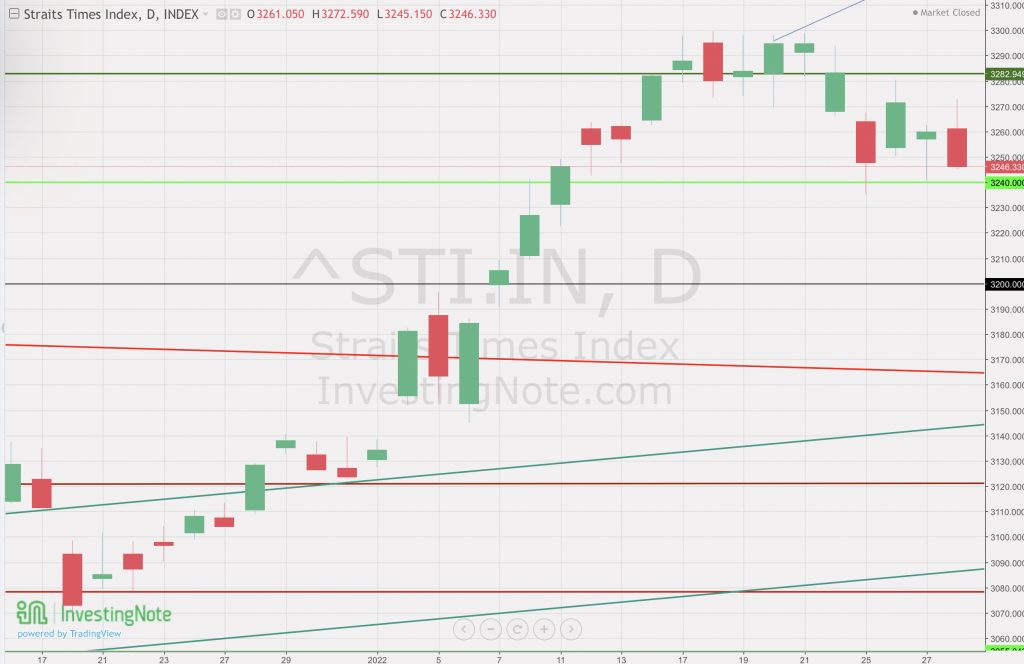
STI – Updated Daily Chart


The STI closed with a solid red candle on the daily chart just above the 3240 level which is another minor horizontal support level. As the coming week is a short week with only 2.5 trading days, do expect a slightly inactive market as more people are focused on the festivities.
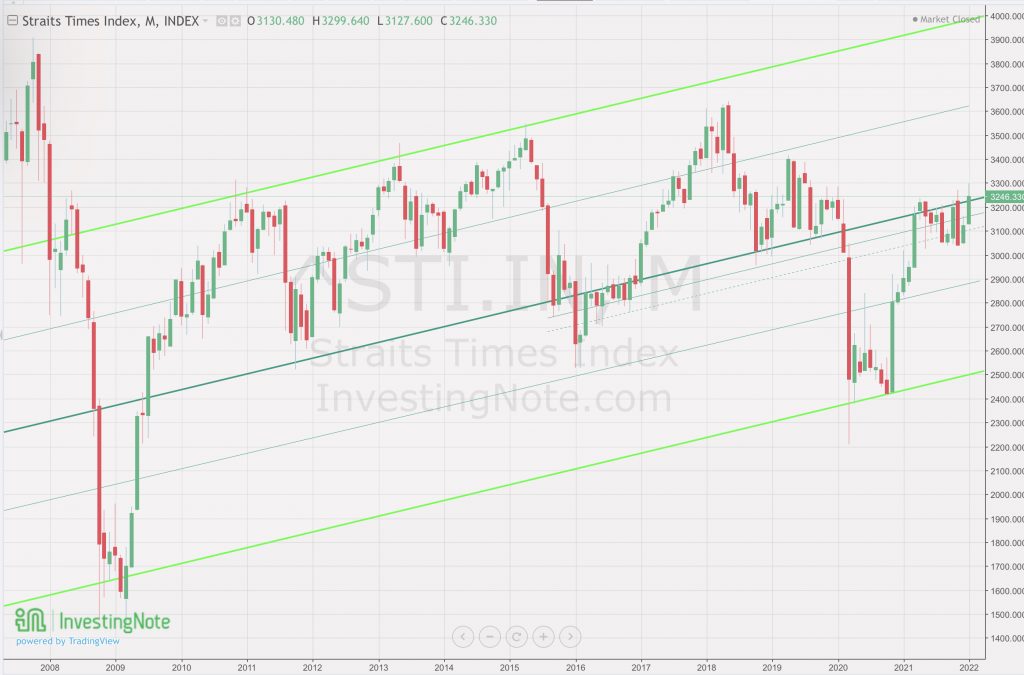
STI – Updated Montly Chart

The monthly chart looks supportive or further growth because it still hovers above the middle uptrend line. We might be expecting more volatility ahead that might not be reflective of the actual market performance so do take the opportunity to execute trades that might make sense to you to get some cash back and reenter in the subsequent dip.
Author’s Call as of 29th January 2022
- Global volatility has increased significantly as the VIX hit above 30 for several days
- The daily chat shows that STI is also facing some uncertainty in the value stock sector
- We should be seeing more movements in the month of February as the US regains stability
- Investors should expect wilder swings ahead on the STI and should always consider selling before buying back to capitalise on its volatility
Author’s Call as of 22nd January 2022
- The STI shows no sign of corrections yet although the US market has already retreated considerably in the past weeks
- Daily chart so far hovers above the resistance line but has not break out of it convincingly
- The STI’s monthly chart looks stable but mellow as there is little difference since last week.
- Investors should still look out for market reactions and see if institutions are coming back to the SG market
- More updates in the next STI market outlook with some fund flow analysis


