Buy more or take profit? (Is this rally going to last)
It has been an awesome rally for the STI thus far, basically, we have seen more than 17% gains since the trough that came right before the rally. That said, many who have joined the rally later has been asking if our celebrations were premature. Since STI is currently cooling off from the relentless climb, we will use technical indicators to give us some idea of whether we should add more or take profit at this current level. On the other hand, with rising numbers and worrying news on the pandemic, should we all be expecting trend reversal in the coming weeks?
The short answer is that perspectives are almost always divided as there will always be optimistic, pessimistic, and delusional views of the market at any given time. Objectively, my suggestion is to always look for the best-case scenario for your own portfolios. This is because we all bought in at different time periods and price points, so consider your actions based on your own relative profit and losses to maximize your gains in the current market.
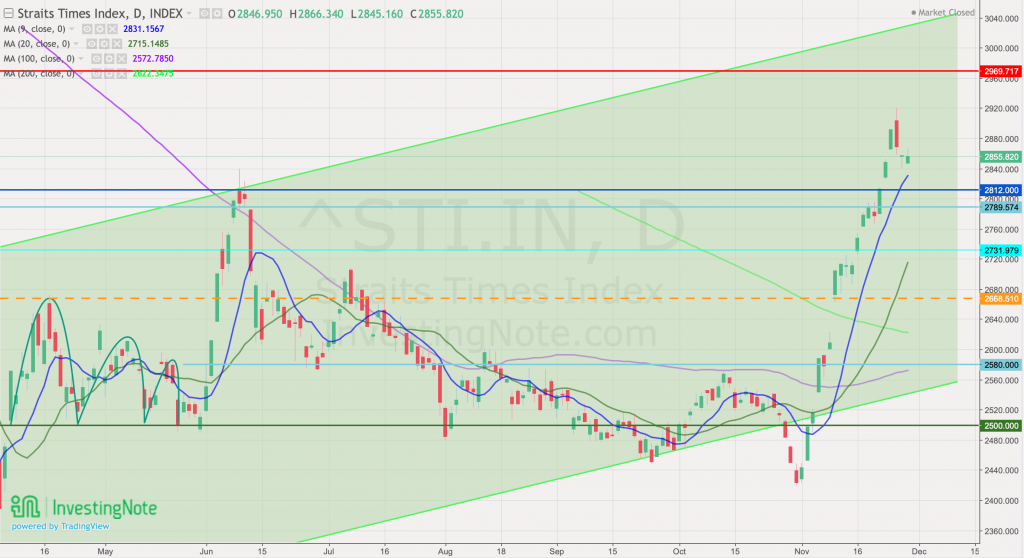
STI – Updated Daily Chart

STI rally has shown weakness during last week’s trading sessions. In particular, we observed that many investors took profit on Wednesday after a brief state of extreme euphoria in the morning at around 10 in the morning. since then, STI has been “resting” albeit having almost the same amount of trade volumes but with much less price volatility.
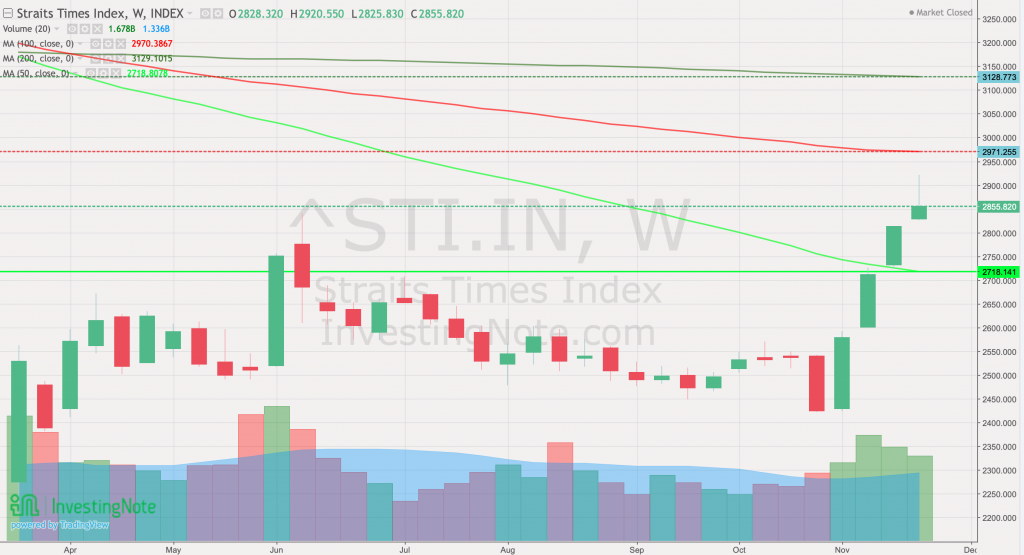
STI – Updated Weekly Chart

This view for the weekly chart is most telling for people who are debating whether STI will head up or down moving forward. Basically, the answer from this chart is that it is 50:50. When it is in such a situation, you should look at the counters on your watchlist and identify opportunities if there are any counters still lagging behind the herd. As for those counters which are already severely overbought, you can either hold or shave to take some profit first.
Fund Flow Analysis until 22 Nov 2020

Institutional players are back and pushing STI constituents upwards rather vigorously. As of 22 Nov, it is noticeable that the buying pressure from institutional investors has slowed down probably cause retail selling has also slowed down considerably. With STI showing weakness in the past week, we should be able to see lower net buy or even net selling from Institutional investors or MMLPs after the data is released in the coming week.
Author’s Call as of 29th November 2020
- STI rally showed last week after crossing the “crisis line” at 2800 but has stayed above and is supported by 9 days MA
- Trump willingness to concede supports market perspectives who are looking forward to a Biden presidency
- Holidays approaching and higher consumer spending is expected resulting in higher revenue
- Many greed rallies has halted in view of the suspension of the travel bubble postponement
Author’s Call as of 22th November 2020
- STI’s immunity to the worries brought forth by second and third waves of infection is apparent at the moment
- Based on the moving averages STI is still showing positive signals for its extension of this recovery rally
- Domestic spending proves to be significant even for tourist-centric businesses
- The healthy expectation of air-travel resuming continues to boost investors confidence


