Have we gone accustomed to the spread of the virus?
If you went out on a Friday night at around town, you would have realised that people are basically out and about despite the worrying number of infections. Although it is true that only vaccinated persons are allowed to enter malls, we are also aware that vaccinated persons are also susceptible to the new delta variant. So does this mean that the retail and service industry is bouncing back? With all that cooped up desire to head out in addition to saved up bonuses and holiday savings from 2020, I think it is natural to see a spike in retail spending. However, I do have my doubts on the aviation industry considering that the international travel are still recovering and the prices of flights are also much lower than before due to the increased cost for PCR test before and after flights. After this week’s I feel that the rate of recovery is still protracted for aviation and tourism hence we should not be too optimistic about the current situation.
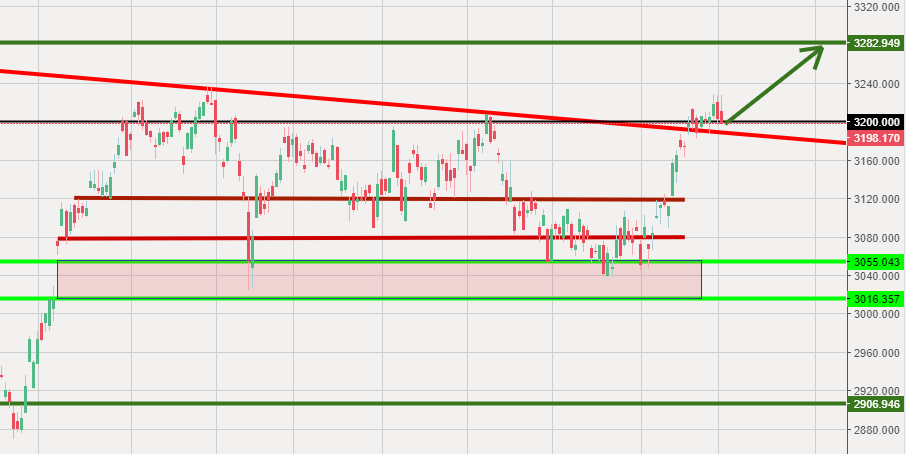
STI – Updated Daily Chart


The STI is still caught at the 3200 level and it closed just below it on Friday. This shows that the market is still cautious about the state of the global economy. Basically, we are starting to see more companies (prominent ones included) report glowing growth. The truth is that inflation is ravaging the economy in US, Europe, Japan and the rest of the world. Therefore, I am afraid of what is to come when it hits the lower strata of society.
STI – Updated Weekly Chart

I am not surprised to see that the STI is still struggling to advance above the resistance level on the monthly chart. This is because the US is obviously hitting new highs at 4600 and we are uncertain that the climb will continue. That said, with all the insanity in the market and unleashed monetary policies, no one really knows when this tapering of QE will ever hit the market. All we know is that when it comes, we will see a huge reaction in the market.
Author’s Call as of 30th October 2021
- The Singapore market is starting to slow and the climb is also muted in view of the concerns caused by the outbreaks
- The daily chart shows that the STI is still caught under 3200 and some counters on STI are starting to retreat
- The monthly continue to show that we are “not ready” to cross over to the upper half of the parallel channel
- Buying back some stocks in intervals is starting to make more sense for investors who have sold in the past weeks.
Author’s Call as of 22nd October 2021
- Last week’s market is still largely undecided whether to climb or retreating but it did end on Friday with a solid green candle
- The daily chart still show a successful attempt to breakout at marker close on Friday
- Monthly chart showed that STI might be testing the same resistance level in the last week of October
- Last’s week’s market performance show that the world is still undecided about the way ahead so investors should stay cautious and consider selling another tranche or batch of stocks in their portfolios


