“KTV fever” poses threat or stimulates vaccination demand?
Doesn’t the charts for the daily case look like the stock charts? Despite being unrelated to demand and supply, it feels as if there is some orchestration going on in the overall statistics of the pandemic. This also shows the importance of math in the understanding of trends. Statistics aside, time time round the government is not reverting back to a blanket restrictions for all people to dine in in groups of 5. Instead, they are allowing vaccinated individuals (14 days after 2nd dose) to have special privileges for social activities. As the numbers continue to fluctuate, the government will be watching transmission numbers closely and hopefully we can get positive numbers in terms of lower transmission in the coming weeks. Looks like we will have to wait for a few more weeks before the market breaks out.
STI – Updated Daily Chart


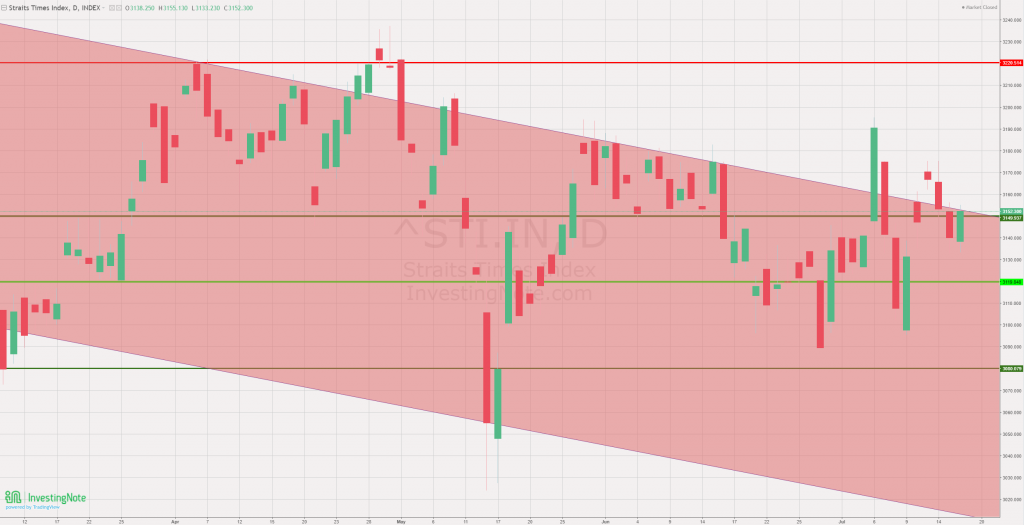
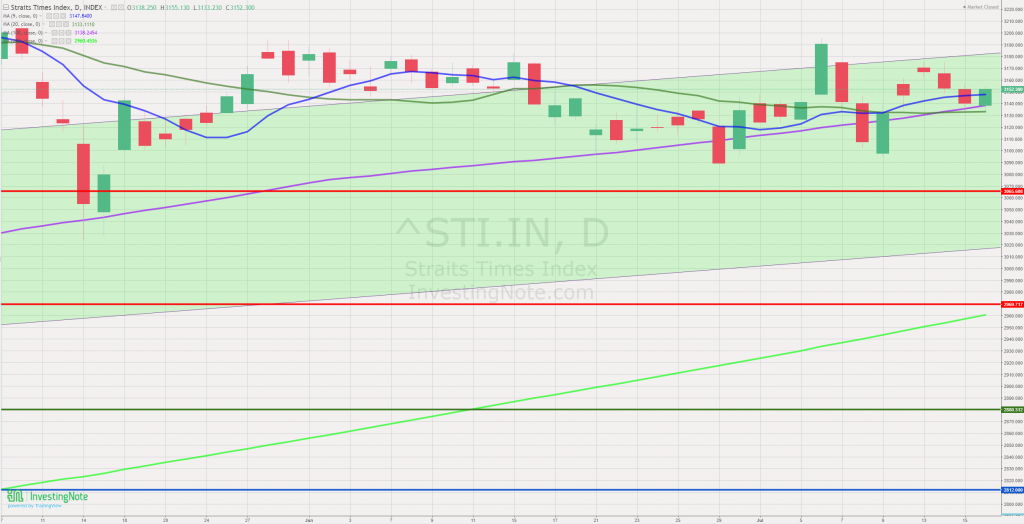
The daily chart still shows weakness and consolidation in the past week. The KTV cluster continues to make investors worry especially if further measures are implemented to try and curb the spread of the virus. However, if you look at the 2 versions of the daily charts, STI is still well supported but in the coming week, market reactions towards the new updates remains to be seen.
STI – Updated Monthly Chart

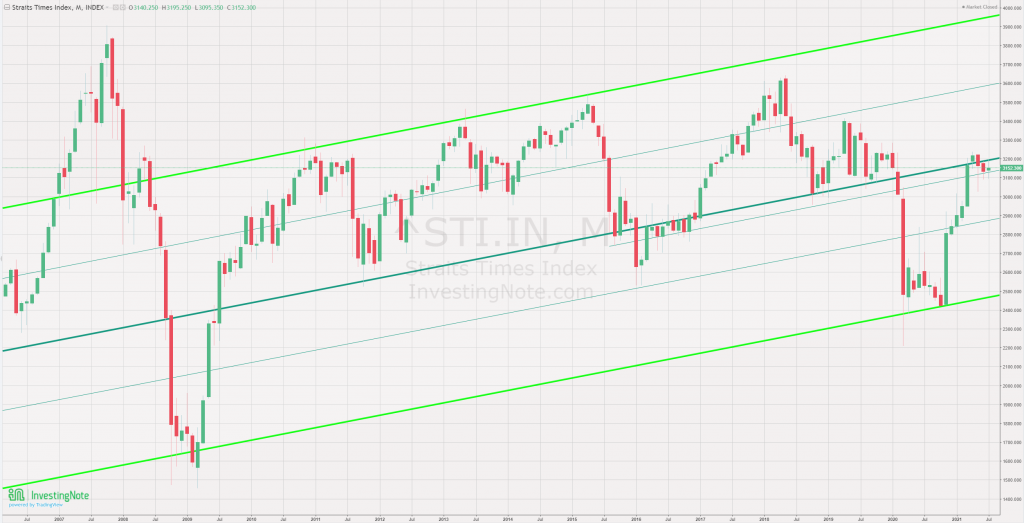
The intermediate uptrend support line drawn on the month chart, continues to be the line of defence for STI to trend up further. As of now, investors should consider selling first to prepare for a potential dip in the market.
Author’s Call as of 17th July 2021
- KTV cluster slows down reopening plans and heightened alert for people and businesses alike
- Chart wise, STI is still unable to breakout from the downtrend parallel channel although remains close
- On the monthly chart, the index is still supported by the intermediary support line
- Selling first to mark your positions and planning ahead to buy back at a cheaper price might be a good strategy as this point
Author’s Call as of 10th July 2021
- The nation will likely benefit from declaring an endemic for COVID albeit some disagreements
- Daily chart support level at around 3110 is still holding and more uptrend to be expected in the coming weeks
- Monthly chart also shows signs of slowing in terms of its downtrend
- Overall sentiments remain positive for STI but geopolitical instability between China and the US continues to maintain higher volatility


