As the pandemic rages, STI retests resistance on the monthly chart
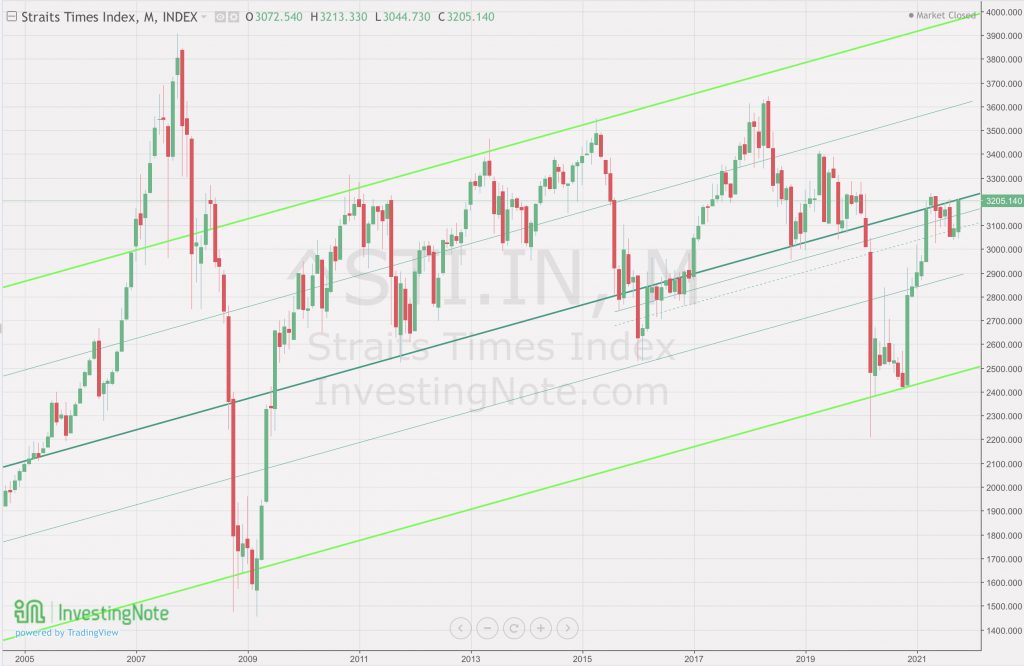
As new infections continue to stay at all time highs (pun not intended), double digit deaths are also slowly becoming the new norm. As a result, the government has extended the measures for October to November in attempt to lessen the increasing burden on our healthcare systems. After dealing yet another blow on the already hard hit sectors such as F&B, and retail, the seemingly immune market continues to try and breakout. That said, there is still a lot more resistance ahead in the near term as we test subsequent downtrend resistance on the weekly and monthly charts.
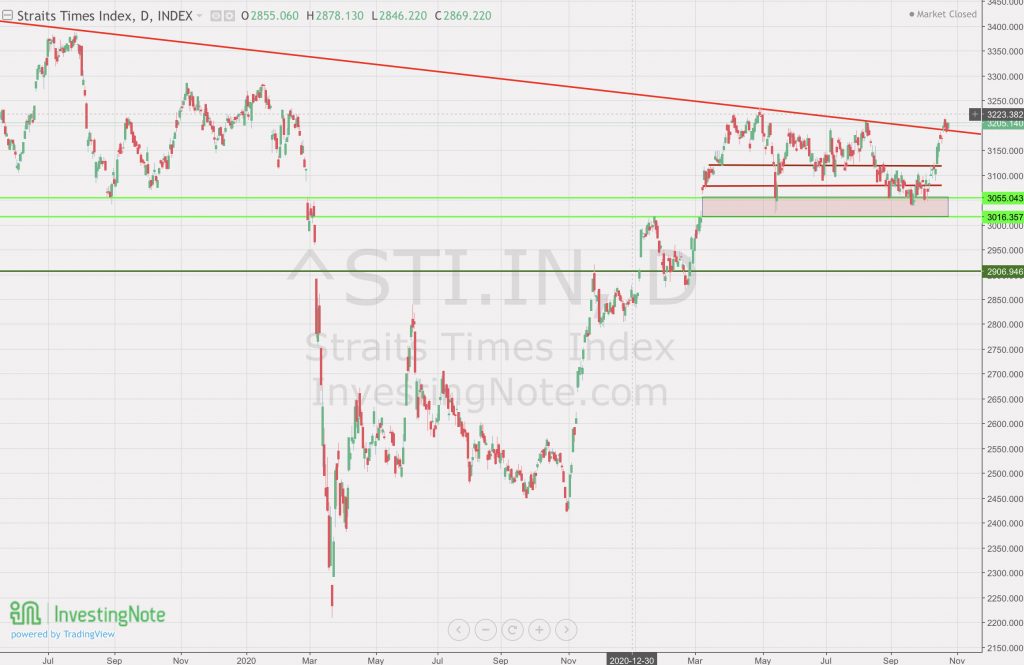
STI – Updated Daily Chart


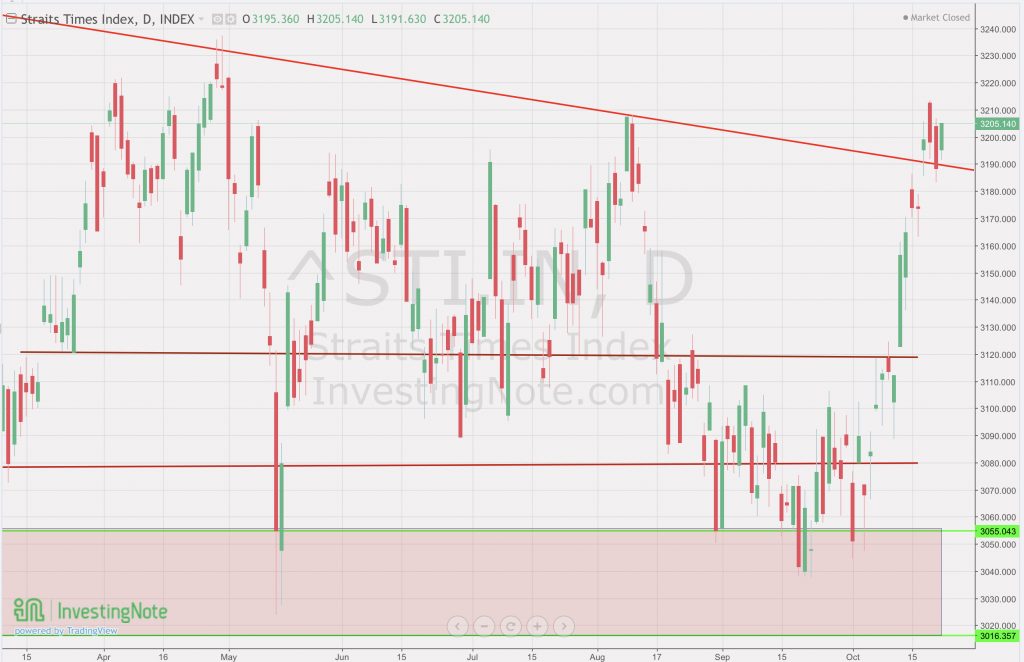
Not a very convincing breakout shown on the daily chart but Friday’s closing was indeed a solid candle stick, signifying that there is still some level of optimism in the coming days.
STI – Updated Weekly Chart

The monthly chart is closely watched as well because many counters have appeared to hit a brick wall on the STI. For example ST Eng (2.92), Singtel (2.59), OCBC ($12) and so on. If we are to see a further breakout, there must be another trigger that is aimed at abating the uncertainties in the economy mainly caused by the spread of the virus.
Author’s Call as of 22nd October 2021
- Last week’s market is still largely undecided whether to climb or retreating but it did end on Friday with a solid green candle
- The daily chart still show a successful attempt to breakout at marker close on Friday
- Monthly chart showed that STI might be testing the same resistance level in the last week of October
- Last’s week’s market performance show that the world is still undecided about the way ahead so investors should stay cautious and consider selling another tranche or batch of stocks in their portfolios
Author’s Call as of 16th October 2021
- The Singapore market is still not out of the woods but the market is eager to have a breakout as shown by last week’s rally
- The daily chart exposes a downtrend resistance line which come in handy to explain why the market did not end with a solid candle
- Weekly chart also show that we are optimistic but could be in for any cautious run in the market
- As investors continue to deliberate been a positive or negative outcome in the near term, I suggest that investors should consider their own stance and decide if the market should recovery even in the midst of rising number of new infections and deaths


