S&P 500 Chart is usually similar to the Dow as both largely represents the US market sentiments. However, sometimes there are some noticeable deviations and here are some of the reasons why.
- Different number of constituents in the index
- S&P 500 is weighted on Market Capitalisation whereas DJI is weighted on share price (Difference in Index formula)
Sample Size (Significance of each constituent)
Since DJI has only 30 constituents, it will be far less accurate in terms of its representation of the us market performance on any given day. However, it is still good to note that DJI is composed by 30 large cap companies in US therefore it will provide a clearer direction of the market in general.
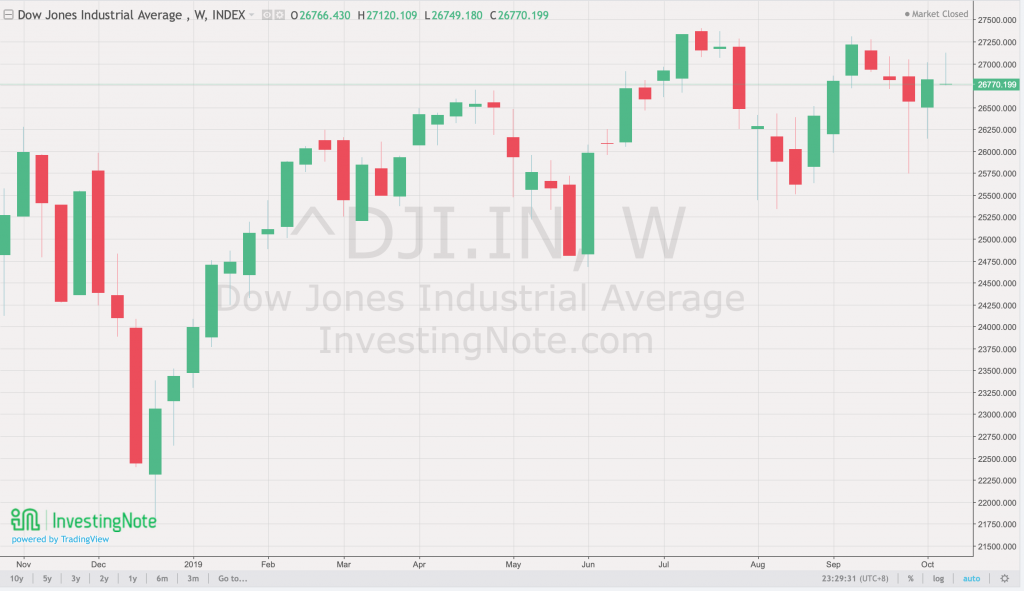
Take a look at both the S&P 500 Chart and DJI for comparison purpose


Looking at both charts, you will notice that there are higher highs and lower lows for DJI as compared to S&P 500. This brings us to the next point on how the index are derived from its constituents. This difference can be seen on the chart as DJI has longer Candlesticks and wicks to represent weekly fluctuations.
Formula of S&P 500 and DJI
DJI = (Sum of all Share Prices of all 30 constituents) Divided by (30)
S&P 500 = (Sum of all Market Cap of all constituents) Divided by (No. of constituents)
The main difference is the use of share prices as compared to market capitalization. Since market capitalization includes the actual value of the company as compared to just the share price, it is more accurate to based our views on S&P 500.
Do note that since there is way more constituents in S&P 500, impacts on major companies might not be as obvious as compared to DJI. Therefore there will still be some benefits when using DJI to take note about the larger cap companies for a hint on market sentiments.
Closing Thoughts
Do keep track of both S&P 500 closely and DJI for the general trend of the US market because it will also shed some light on how Singapore’s market will fare in the next trading day. For example. if there is a huge drop in both major US indices, you will observe a similar trend in STI the next trading day. Do note that NASDAQ is similar to S&P 500 however NASDAQ has more components than S&P 500.
What about NASDAQ?
Personally, I do not look closely at NASDAQ because I feel that the former indices are sufficient to get a sense of the market. Furthermore I feel that NASDAQ has “too many” constituents, in fact it has more constituents than S&P 500. Thus i still feel that S&P 500 is still the sweet spot for understanding the US markets.
I hope this post informs us more about the difference between DJI and S&P 500 and explain why news platforms often use these indices for discussion.


