The INDEX that cried wolf – Story of STI
Backed to a corner, STI is really tested to the limits in recent months. On one hand, we can rest in the comfort that our economy is built on the foundation of sound politics and valuable human capital. But on the other hand, our hands are tied because of global geopolitical tensions on top of the grave impacts of the pandemic. If you have been staring at the chart of STI in recent weeks, you would have noticed the extent of disinterest from big-time investors and funds but at the same time our positive stubbornness from other investors holding on to what hope they have left. This tiresome tug of war is causing more than just impatience but also worries amongst passive investors as well because they have been averaging down to provide support where possible. In this week’s technical analysis, it is noticeable that STI is still hanging on to major support levels with low to moderate volume.
STI – Updated Daily Chart
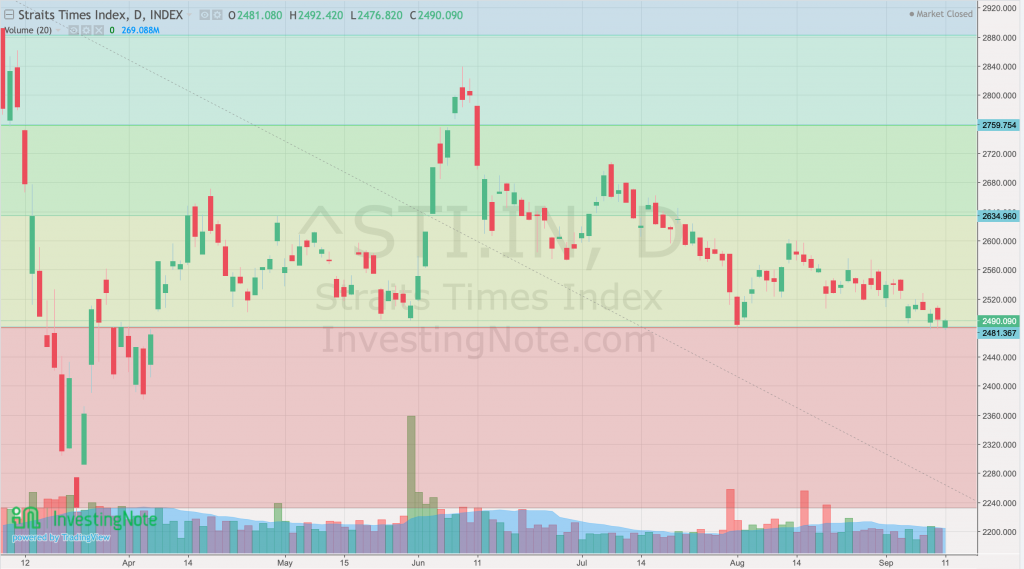
STI closed just about the fibo level acting as support. It truly is a potential entry point for investors but also a critical point for investors who have entered at a higher price point. From the daily chart, we are able to notice that STI is retreating but has bounced from around 2480 last week.
STI – Updated Monthly Chart
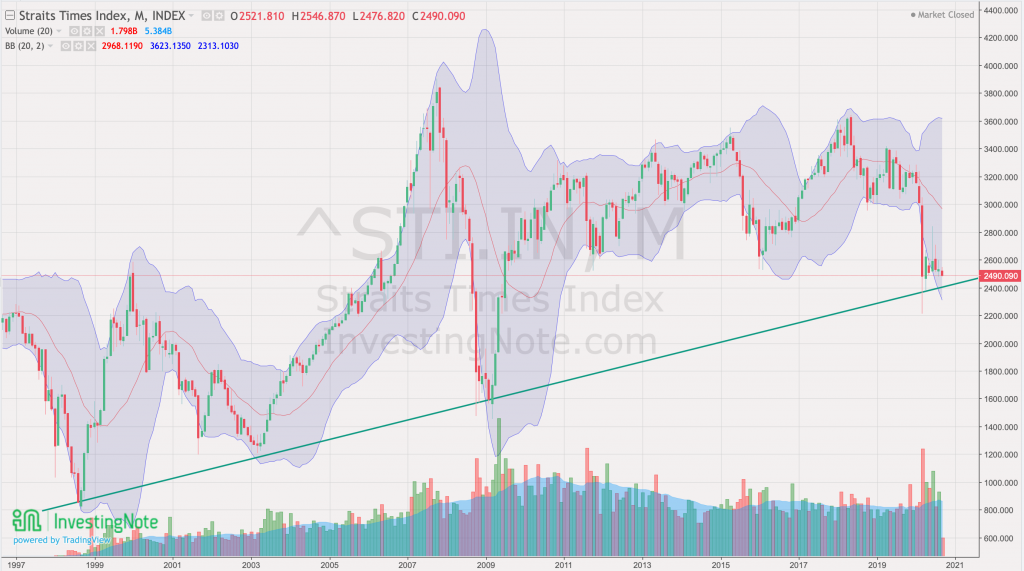
The only remaining monthly support of STI is shown in the chart above. Currently STI is approaching the strongest known uptrend support and we will be expecting buying pressure for technical traders simply because such opportunities only come every 10 years.
Special Feature – Challenger (573)
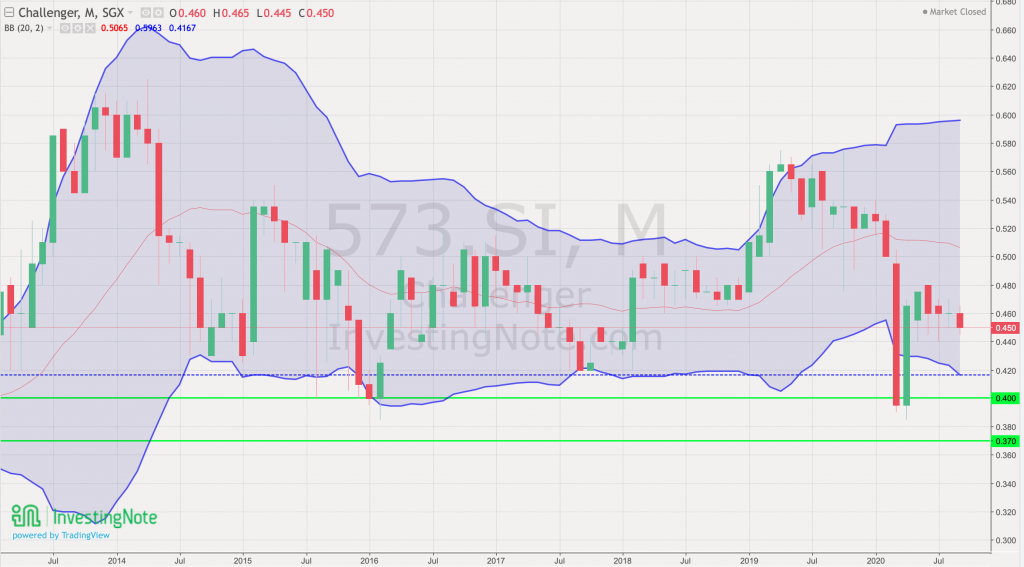
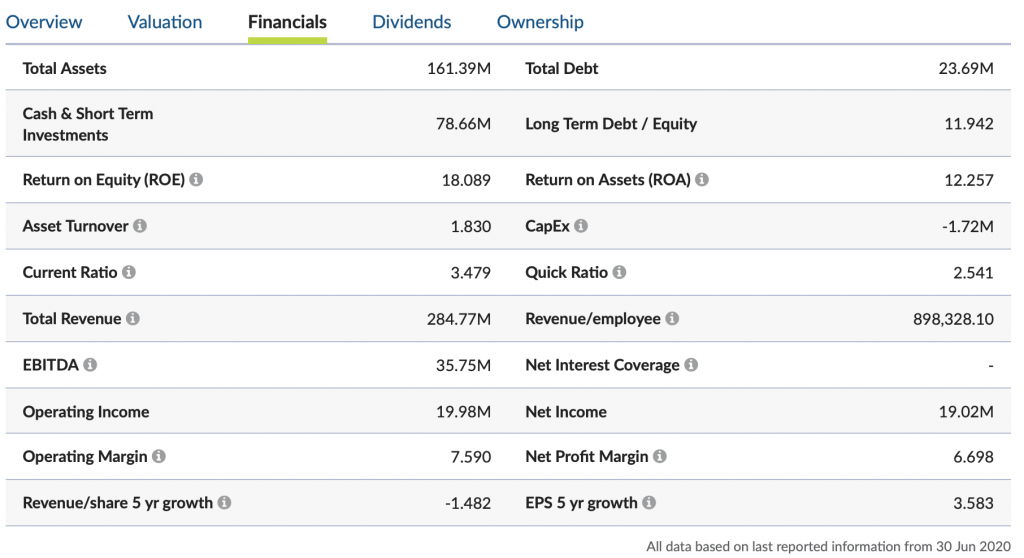
Challenger is one of my top picks as an investor simply because of its high Return of Equity (>15%), Cash Balance to Asset ratio (0.487), and high distribution yield (4-5.5%). This company is really a gem in the sea of companies outside of STI. In fact, it is hard to accumulate as well because investors are usually unwilling to let go of Challenger therefore causing its stock price to remain relatively stable. Investors who are into stable yield (post-COVID) and growth potential may start collecting more Challenger stocks when possible.
Author’s Call as of 13th September 2020
- STI is not reacting to the supposed bounce at 2500 support level however it is still holding stable at the moment
- 3rd Quarter performance will be way more positive than Q2’s and will be priced in due time
- Technical analysis of STI suggests that the index is still tied between buying and selling pressure
- Many reputable sources have stated that STI has bottomed but the supposed rebound that follows has not happened
Author’s Call as of 6th September 2020
- US Market correction led to STI’s stumble on Friday but STI closed above 2500 support on Friday (without volume support)
- Singapore market is still showing no significant signs of recovery but is still holding steady at the moment
- Triple bottom formation signals bullish price action
- The further downside in STI is possible but several blue-chip counters are already undervalued


