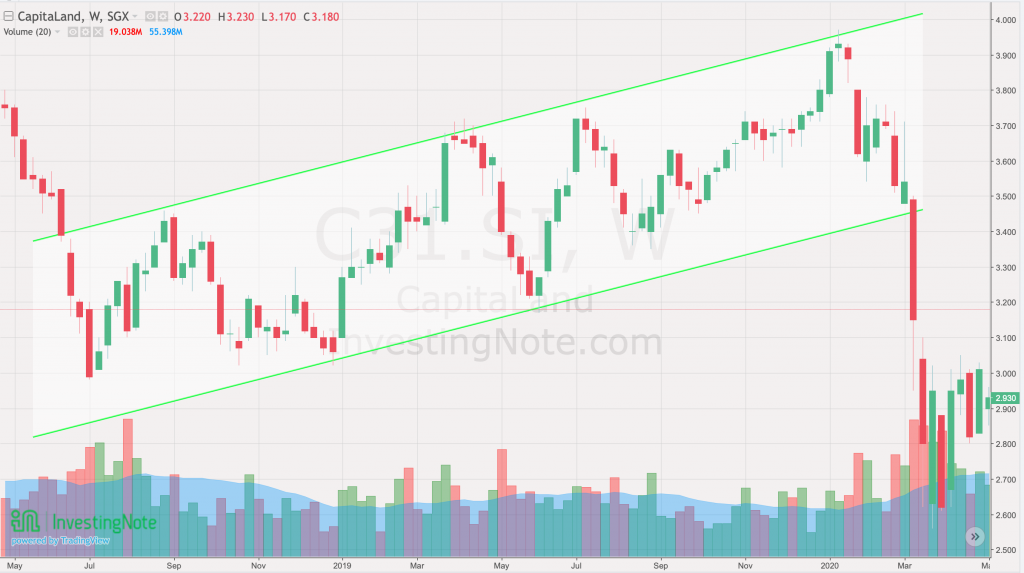
Let’s face it, even though market conditions change over time, it usually returns to a state of consolidation. In fact, you zoom out from a daily chart to a weekly or monthly chart, you can usually map out a state of consolidation immediately using simple tools. However, in recent days since the market fallout, we are beginning to see many counters that are breaking their major support levels, this means that we can no longer make sure of those lines identified over a long period of time. In fact, many counters fell to a low which was below the price of the 2008 financial crisis, therefore in the post, we will learn a new strategy to find the new support level at the present moment so that we can continue to trade between the support and resistance levels.
Identifying support and resistance level or “consolidation zone”

Looking at the above example of Capitaland, you can identify the support and resistance level from May 2018 to March 2020. Such zones when identified early will provide at least some level of certainty when the company is not going through major changes, whereas its share price is just going through a series of market fluctuations. As such, it would be wise to identify those zones as early as possible so that we can make full use of the bounce zones when it reaches near those price points. While this might seems easy to do in retrospect, it takes a combination of techniques to execute.
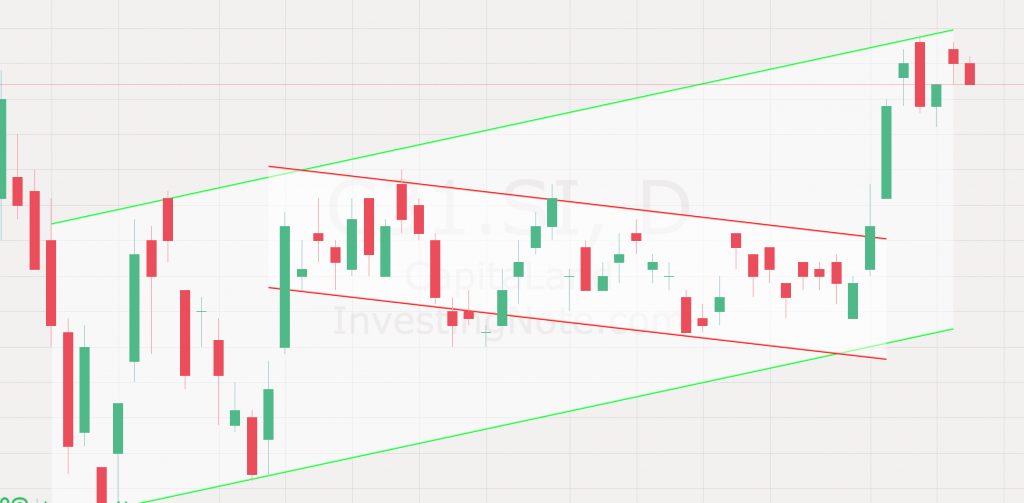
Example of Plotting current consolidation zones

Looking at the current state of Capitaland, we notice that it is on an uptrend and it is understandable since there has been a plunge due to the Covid-19 situation. From the daily chart, we notice that Capitaland is at the upper limits of the parallel challenge or “consolidation zone”. This will provide us with the guidance on the potential bounce zones which is reflected in the last few days of trading as Capitaland land was not able to break out of the resistance.
Practical steps to take while finding support levels
- Buy the first tranche as a place maker
- Identify lows and highs in the recent candlesticks
- Buy subsequent tranches nearer to the lows
- Plot a rough parallel channel touching as many candlesticks as possible
- Sell lower tranches when possible to average down on previous tranches
- Adjust and lengthen (extrapolation)
- Sell some of your tranches when it hits near the upper limits of the consolidation zone
Closing thoughts
My best advice for readers who are interested in this method is to try it yourself so that you can make full sense of this technique, which will serve you well in the long run. Initially, you will be caught in situations where your first tranche might result in paper losses however, it is still important to put a place maker so that you are able to mark your positions more accurately. This post is done in continuation of last week’s post which was on “buying stocks during an upturn” because it is not good enough to take action but to also identify these “consolidation” zones as soon as possible so that you can trade based on those zones to maximize your profits.


