Why do investors use candlesticks instead of line charts? After all, don’t they all represent the same price movements over time? The answer is yes, the charts are all showing the same price movements over time, however, candlesticks can provide additional information to the user and that can translate into information like the current market sentiments. This information can sometimes be crucial as it can represent, oversold, overbought, price bottoming or peaking, etc. In today’s post, I will be summarising all this information so that more people can appreciate candlesticks and their significance to investing and trading.
The Anatomy of Candlesticks
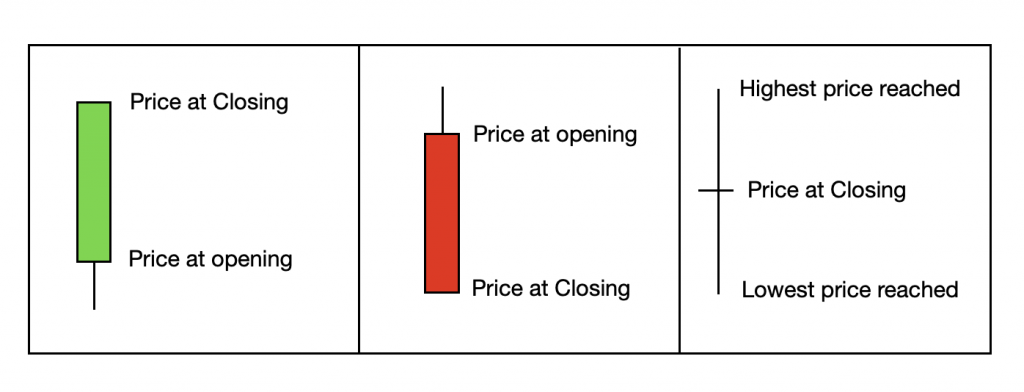
Literally, everything you need to know about each candlestick is shown in the three examples above. Do take note that the green and red candlesticks have inverted “Price at closing” and “Price at opening”. Apart from that, the wick (if there is one protruding from the candlestick) is just additional information showing how far the price has gone within the timeframe of each candlestick.
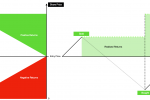
How to read market sentiments using candlesticks
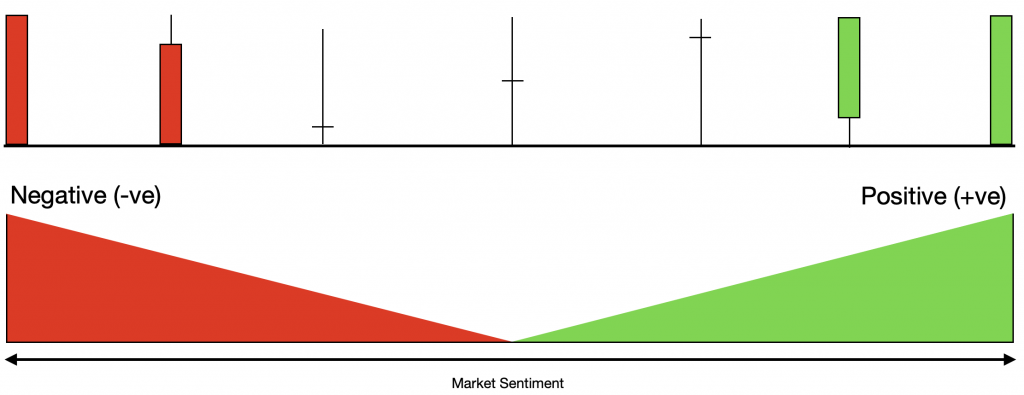
From the above image, we see that solid candlesticks represent both extremes in terms of market sentiments. Therefore, when the green or red portion of the candlestick is relatively short it also means that market sentiments are changing accordingly. Whereas for the three candlesticks in the middle with no red or green wax left on it, it shows that the opening and closing price during the active duration of the candlestick is identical Hence, in such a scenario buyers and sellers effectively canceled out at the closing of that session. That said, do note that in the case of having a “Waxless” candlestick, the wick above and below the closing price becomes the most informative as the longer the wick on either side signifies the effort put in to push up or pull down the share price.
Experience using Candlesticks
Candlesticks offer the most amount of information in a single unit furthermore it can help you detect gaps between the start and closing of each candlestick. Such information is certainly lost in a regular line graph that is why candlestick graphs are better when representing price movements. Personally, I feel that besides showing more information to the investor, candlesticks are also useful to spot trends ask the length of the candle might shorten or lengthen over time thus showing a possible trend reversal.
Closing Thoughts
I feel that candlesticks for investors are somewhat like musical notes for musicians. The condensed form of candlesticks provides quick snapshots of how market players are reacting towards the current market. As such, learning and understanding candlesticks will be an indispensable skill if you are interested to make sense of price movements, market sentiments as well as spotting potential trend reversals.