Straits Times Index or Bank Index?
Well, if. you notice, the index is currently carried by the bank for the past few weeks. Sure enough, some stocks are outperforming recently but those rallies are sudden and short-lived. Whereas, our bank stocks continue to benefit from the proposed rate hikes in the US due to record high inflation data. For the Singapore market, it is still battling whether our upsides are sustainable and justified. Personally, I do not think this rally will be long-lasting because the outlook for the year remains dull as the world continues to navigate through massive inflation pressures and the persistent pandemic.
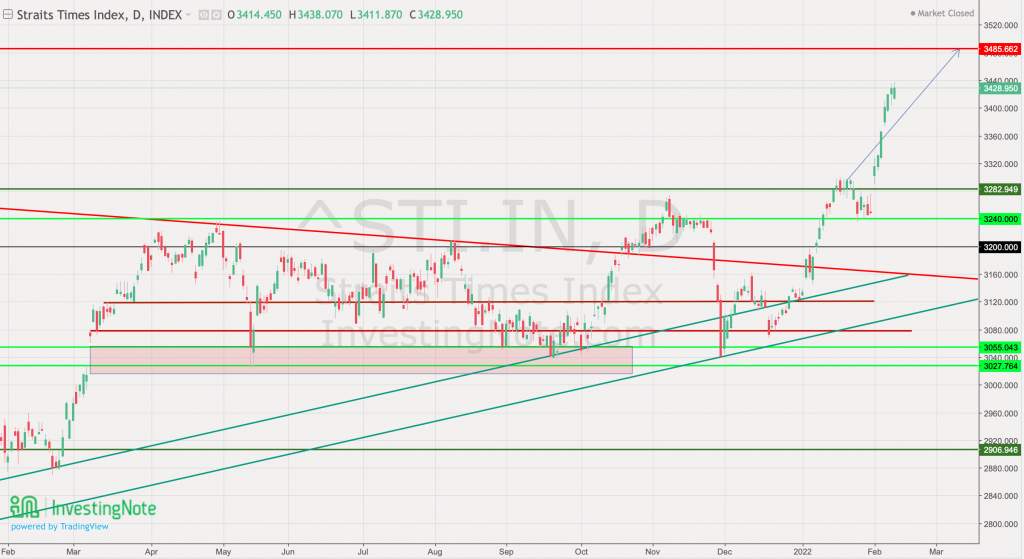
STI – Updated Daily Chart

We can expect the index to trend higher towards the horizontal 3485 level but with the somewhat thin ascension, I would expect a rather violent correction happening near the next resistance or if a particular trigger is impactful towards value stocks.
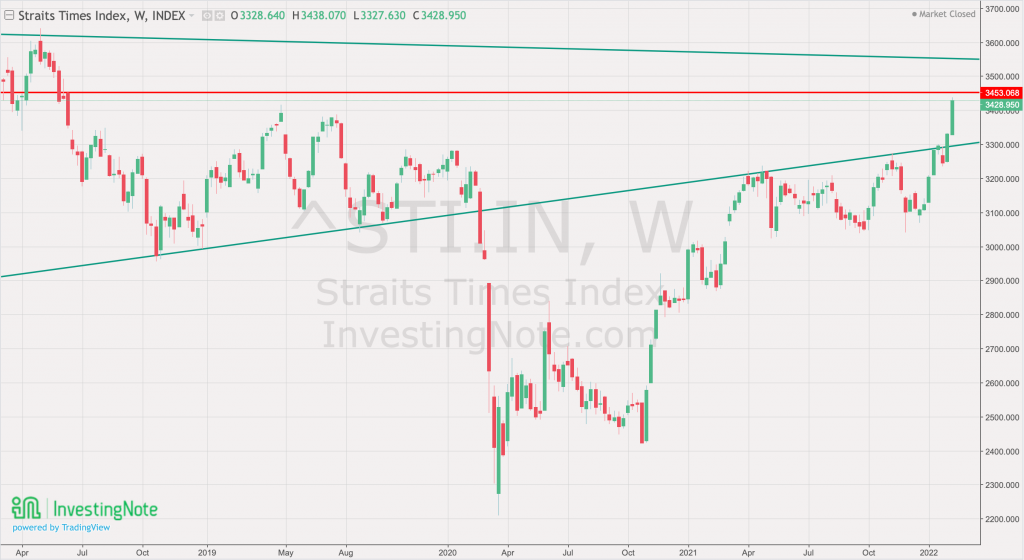
STI – Updated Weekly Chart

The stamina of an STI rally seems to be short-lived for the past few years as the market is more conservative compared to other markets. I have identified that there are 2 significant levels to look out for in the coming weeks and they are 3450 and 3550. Beyond that, we will be in overbought territory and trading will become increasingly risky.
Author’s Call as of 12th February 2022
- STI’s rally continues but does not look like it will be lasting as last friday’s candle was not conclusive
- Daily chart looks unstable and we should be expecting a correction if there is sufficient reasons or a trigger
- Weekly chart looks convincing but the stamina of STI’s rally has not been very long in history
- We are approaching over bought territory so trading should be focused on weaker counters, time to sell those that are overbought to redeploy your capital
Author’s Call as of 5th February 2022
- Omicron infection rages but the market is still supported by value stocks and our banks
- Daily chart was bullish in the last 2 days of the short week but will not be deterministic
- Weekly chart also shows a breakout but will need more time to determine if it is not a false breakout
- Investors should start selling if you are already near your targets to avoid impending dips which might still be possible if other triggers emerge.


