Steep drop last week unwarranted but reflects underlying instability
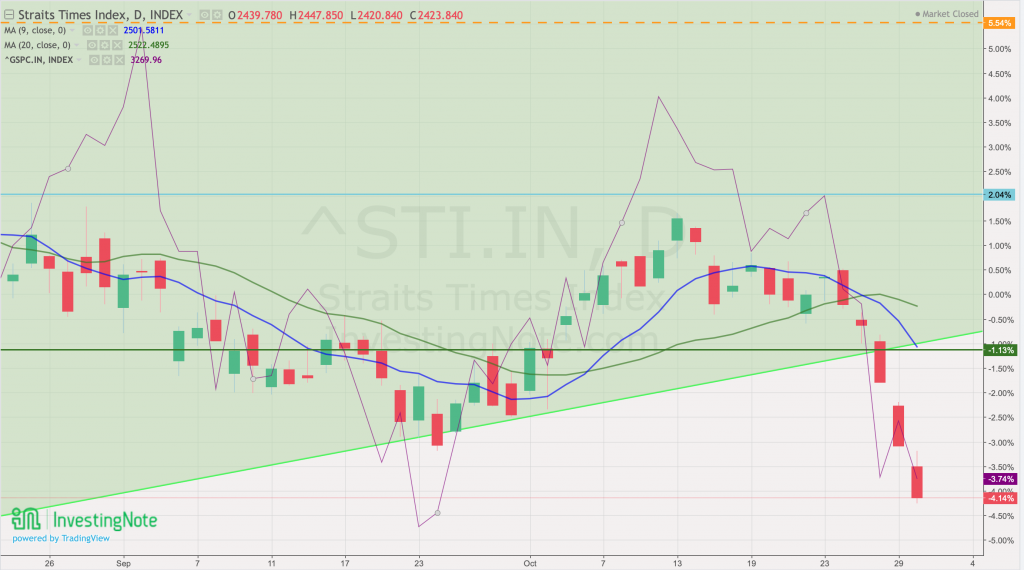
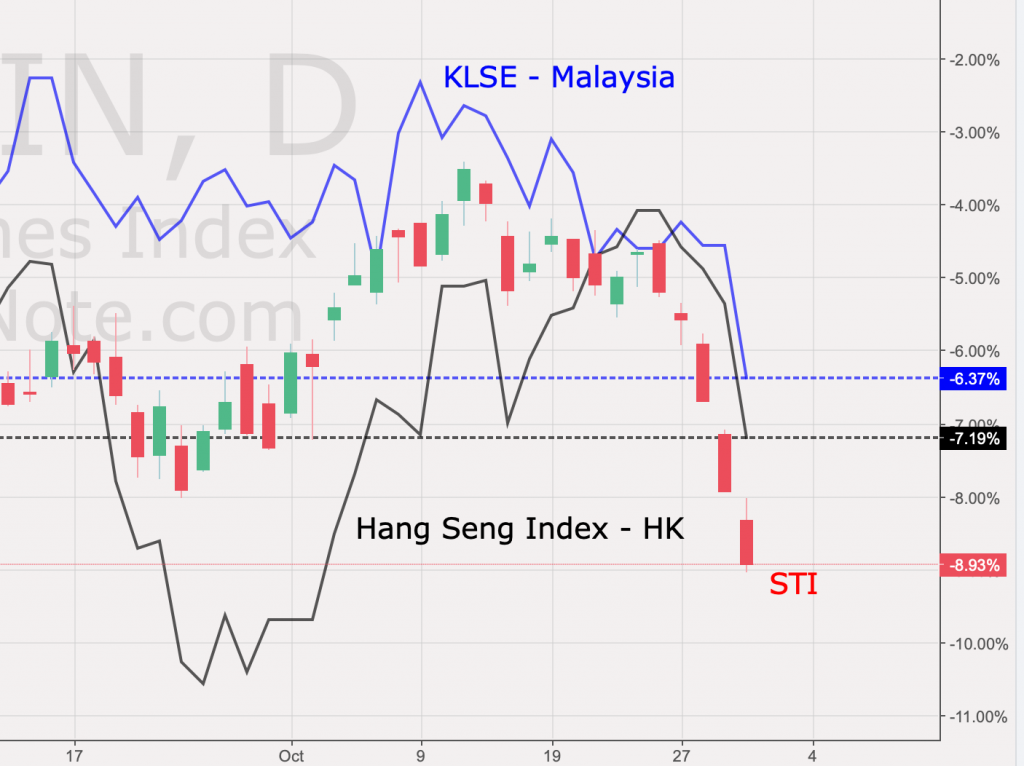
Horrendous drop in the past week with a gap between candlesticks heading to new lows. Apparently, this is caused by the obvious delays from the highly anticipated stimulus in the US. This is on top of the lopsided polls favoring a Biden win that would affect the value of risk assets due to the eventual increase in corporate taxes in the event of a Biden Presidency. That said, Singapore’s market performed rather poorly compared to HSI and KLSE. In this week’s post, we will try and look beyond the erratic performance of STI and discuss about possible actions to take in the coming week.
STI – Updated Daily Chart


To say the least, if you have been earnestly following sound investing strategies then you should be feeling rather defeated and dismayed. On the other hand, we can also once and for all prove that justifications from media sources are unreliable and reactive in nature. One example was the justification that the media used to explain how STI fared during the peak of the corona outbreak in Singapore. With community cases dwindling to almost 0 per day, it is only natural to see some level of recovery but instead the index continue to stay vulnerable towards all other news items.
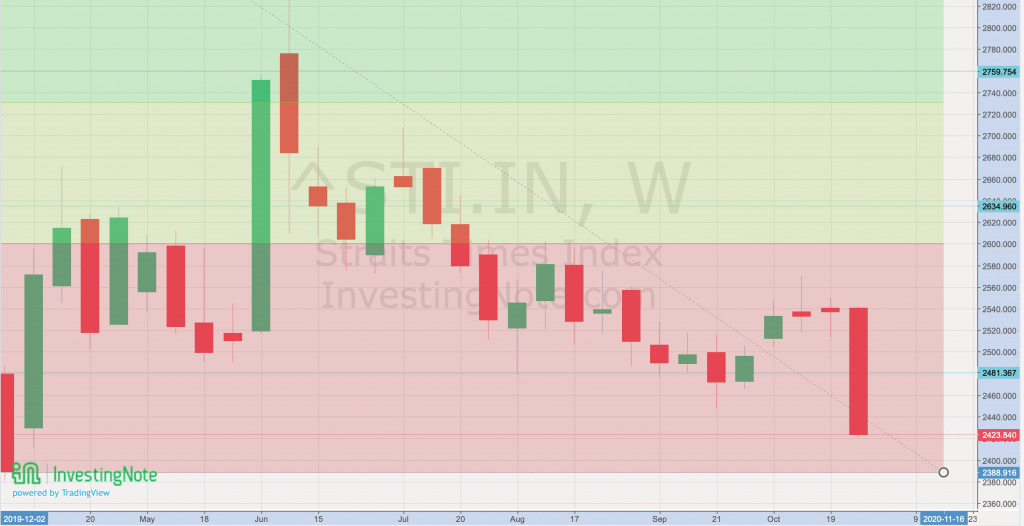
STI – Updated Weekly Chart

STI’s Weekly Chart shows that we are still heading lower and in the coming week, we should continue to see increased volatility in either direction. One can only hope to see a slight rebound nearing election day.
Author’s Call as of 1st November 2020
- Aggressive accumulation of blue chip stocks that plunged in the past week
- ETFs of STI is a possible option for investors with smaller amounts of capital
- US elections on November 3rd will determine if there would be more selling for the US market
- STI is still showing no signs of recovery, hopefully last week’s price action was an overreaction
Author’s Call as of 25th October 2020
- STI closed about 2533 and uptrend support is formed
- The daily chart shows early signs of a trend reversal
- The US elections and discussion on the relief budget continue to cause volatility in the markets
- The weekly chart shows mixed signals as STI closed only marginally higher than last week.


