Trumps Declaration of National Emergency did not tame the market
With all the guns fired from the FED and daily PR operations from the White House, the market is still tempting both buyers and shortists to wait for lower lows. At this point, there is little merit in guessing the bottom already because the valuations of stocks and REITs in SG has already reached a much discounted value with more than decent yields. In the coming week, look out for the next Fibo retracement level of 2335 and start picking stocks of your choice which is are quality companies in your point of view with support from Fundamental analysis.
STI – Updated Monthly Chart with RSI
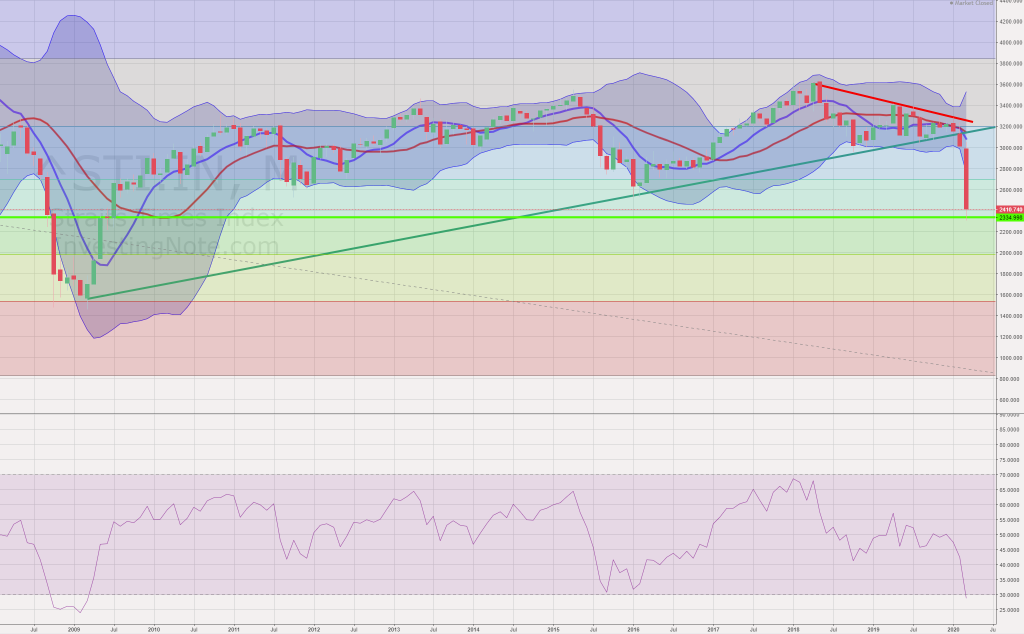
The above monthly chart of STI suggests that there was a strong support from the next fibo levels. Furthermore, RSI also suggest that STI has arrived at oversold territories. While there is sustained uncertainties in the markets, there is comfort in the knowledge that you are buying at a much awaited discount. If you have been waiting for entry, perhaps now is the time for you to accumulate at the next STI support at 2335 or thereabouts. Bearing in mind that every stock as its own support levels and psychological support levels.
STI – Updated Monthly Chart
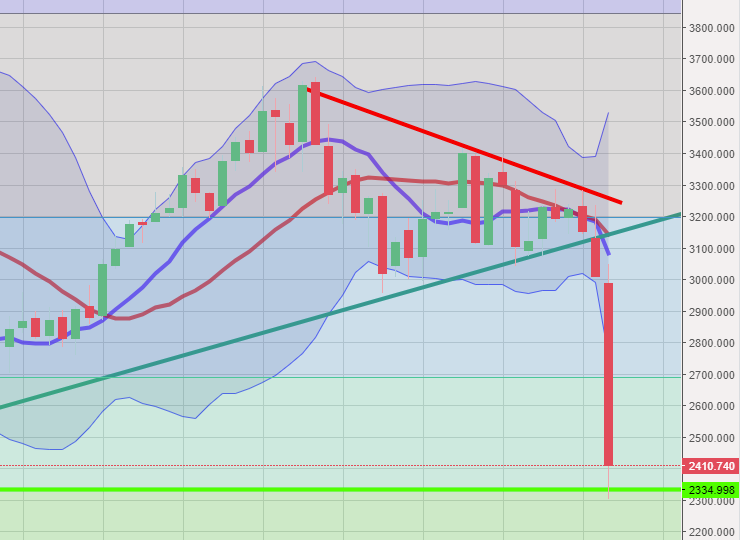
There is no sign that downtrend has stopped however, there is also no way you will be able to anticipate a rebound or a recovery. More often than not, the recovery happens before you know it and the market has already priced in the rebound before you can react. At Loopholes Singapore, we take advantage of opportunities but we will never time the market. Plan ahead and see if it meets your risk appetite.
Author’s Call as of 22 Mar 2020
- Support level at 2335 possible entry point for longer term investors in STI
- Many blue chips are offering high yields at the moment, worth considering
- Plan ahead and purchase according to your time horizon
- Short term plans can be based on previous year yields to set a reasonably advantageous entry point.
Author’s Call as of 15 Mar 2020
- STI fall yet again but at the week’s closing it crossed the major horizontal support briefly and bounced upwards
- STI might still experience high volatility due to the instabilities of the US markets (VIX still above 50 atm)
- We can look at the coming days and weeks to see if there are any “good news” or bad ones that can trigger further downsides or a potential recovery
- Every market crash does not last long but it will usually feel longer than you would like it to so please practice caution and consider your time horizon before buying large tranches.