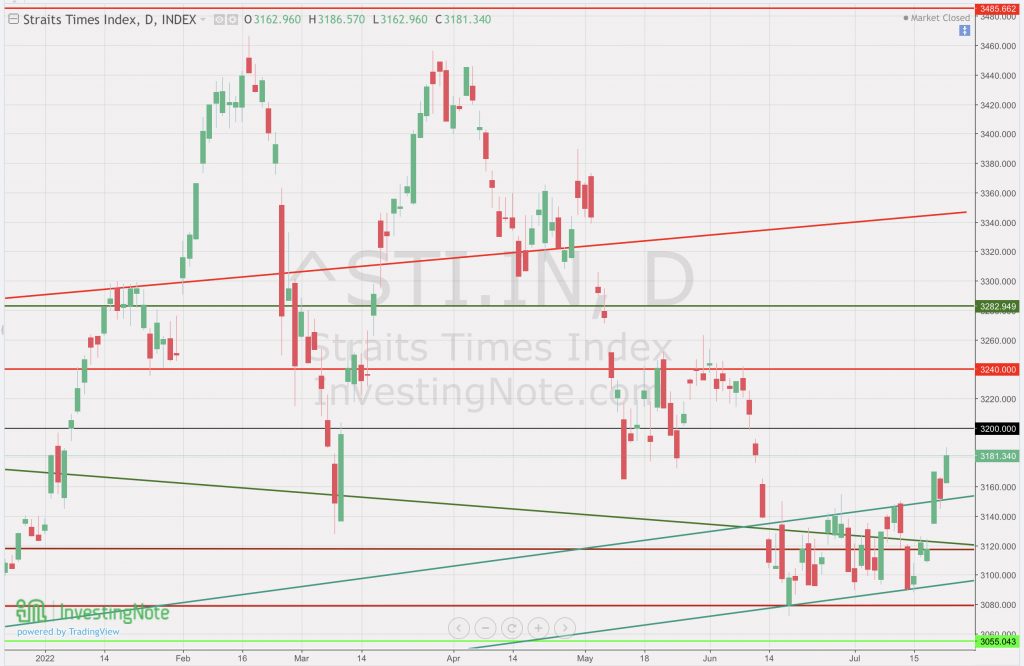
Finally a breakout from consolidation?
Singapore just announced that they are still looking at around 3.6% GDP growth for 2022 while expecting inflation to be around 4.8%. This means that the growth is likely going to be muted by the impacts of inflation. That said, we will still expect more positive reporting of performance especially in terms of revenue. As to why the market is attempting to breakout? It might be a technical rebound since the US market has also stayed relatively positive for the past week. At the moment, many investors should be feeling wary of this breakout from the consolidation zone as it might be short-lived before all the earning calls start rolling out in the coming weeks.
STI – Updated Daily Chart

The breakout from 3120 level quickly advanced to 3150 showing the eagerness for investors to get out of the consolidation zone as it has lasted for more than 3 weeks. The candlestick at Friday’s closing seems to be relatively positive but we will still need to see if it will climb back to 3200 and 3240 to know if this is optimism is genuine.
STI – Updated Weekly Chart

Clearly the candle stick last week was more positive and aggressive compared to the past 4 weeks. As mentioned for the past 2 weeks, this might be due to the 100 weekly MA crossing the 200 MA. Take note of the next 2 week’s candlestick to confirm if this breakout is authentic.
Author’s Call as of 23rd July 2022
- Shaky grounds as the world navigates through inflation and a subtle currency currency crisis
- Most companies will start reporting their earnings in the coming weeks so look out for them closely
- Weekly chart sheds the most light this week as the 100 weeks MA did continue to cross the 200 weeks MA convincingly (for now)
- Do not hold blindly during this period but instead look out for opportunities in the market where the attention is lacking to get better deals
Author’s Call as of 16th July 2022
- The lack of a positive stimulus has led to the STI heading back to the lower ends of the consolidation zone
- The charts are Not showing much details on the trajectory besides hinting that the 100 weeks MA did not have enough support to cross the 200 weeks MA
- looking at 3080 and 3055 level will help to see if there will be further downside
- Stocks that have bottomed might start to rally again soon if there are good news otherwise many investors might be waiting for looking at particular counters that have depreciated significantly without concrete reasons


