News about infections peaking has worn out, time for another downtrend
In the coming weeks, there will be many financial report released for Q1 of the company and due to the pandemic, there is no doubt that the virus has impacted businesses at many levels. As for Singapore, our circuit breaker also just extended to a tentative date of 1 June 2020. Therefore, there is unlikely going to be positivity lurking in the market in the coming weeks. However, counters such as Sheng Siong and Dairy Farm are outperforming in this period but these exceptions are over bought and should be treated with caution.
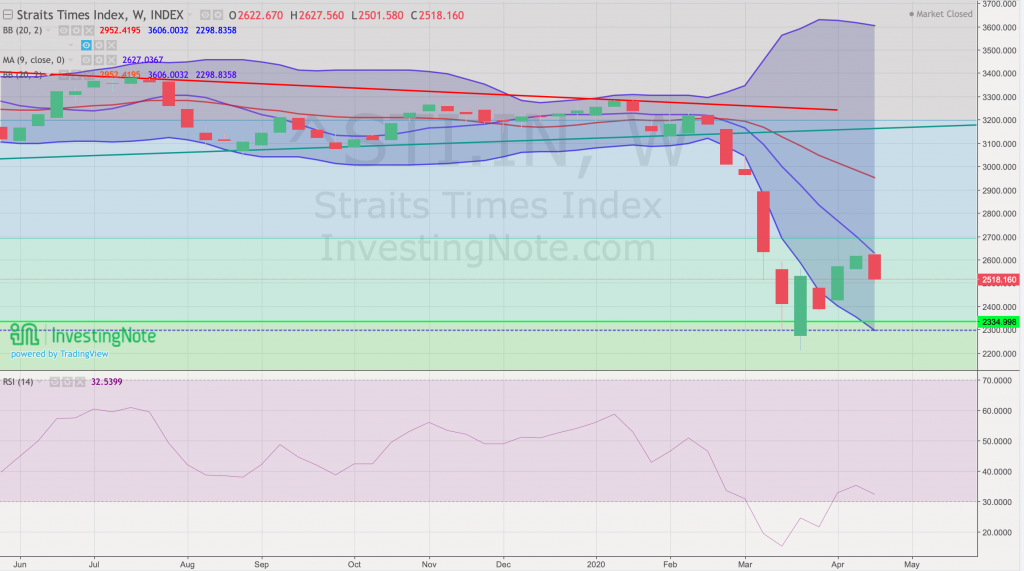
STI – Updated Weekly Chart

From the weekly chart, there is signs that the market is limited by the fibo retracement resistance level at 2699. Also, if you notice the 9 week MA, the market is going to retest the support level of 2334 in the coming weeks. This might or might not occur depending on the news and development of the virus. In other words, while TA presents signals and hints, they are not fool proof.
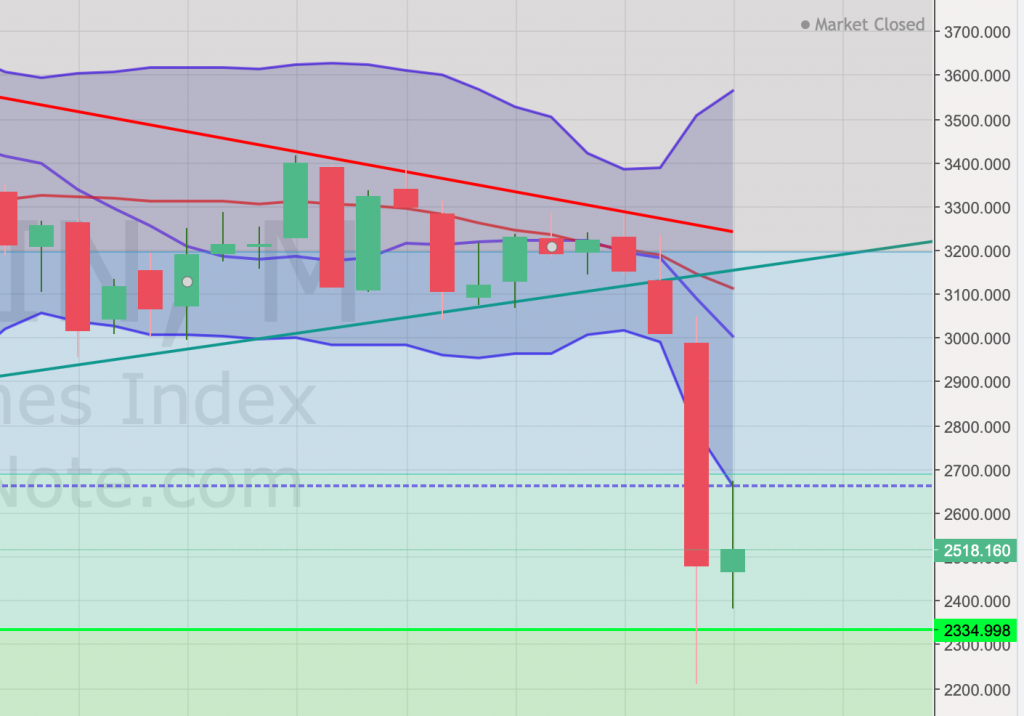
STI – Updated Monthly Chart

On the Monthly Chart, we see further confirmation that the fake rally did lose steam. However, there is no need to wait for any “bottom” again, buy-in tranches according to your personal realistic price targets. To Reiterate, the next support level is at 2334 and the success of that support holding depends on the developments of the virus and the reopening of the economy.
Author’s Call as of 26 April 2020
- US is desperately trying to reopen its economy and some people are already breaching the lock down
- US Congress just signed another 690B bill for corona virus relief (impact always comes later)
- STI will be rather boring in the weeks to come except during their financial report releases and CDs
- Urge investors with sizeable war chests to start setting entry price targets and buy in tranches to prepare for the next upturn.
Author’s Call as of 19 Apr 2020
- STI finished last week with a green candlestick showing continued rallying towards the fib resistance at 2669
- Currently, the monthly chart does not show any signs of the rally slowing down or ending prematurely
- No signs of markets recovering anytime soon though countries are announcing “good news” soon such as restarting the economy and number of infections peaking
- US indices finished on a high again on Friday thus there are no sudden dips expected for STI on Monday morning.
- Friday’s selling at near end of day was probably due to profit-taking from cautious investors


