Will it bounce or crack?
The significant increase in community cases in Singapore has yet again triggered some selling in the Singapore market. However, the pessimism has been dampened by the fact that the MTF is no longer reacting like before with heightened alerts and restrictions. On the other hand, with the US trying to maintain all-time highs, other markets are unsure when the correction would come and if it would affect other markets. At the moment, any logical person will tell you that the US market is overheated but the buying seems to be supported by excess liquidity and “late comers” in the market. As investors, I think we can exercise a bit more caution and only buy stocks if we have sold them at a higher price to make the difference but I would advise against accumulation even when the price is lower than usual.
STI – Updated Daily Chart
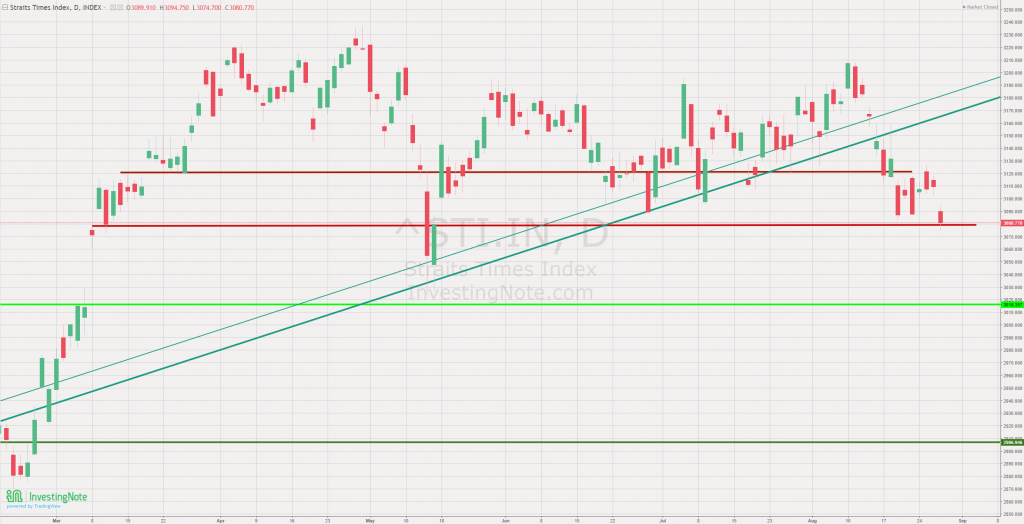
On the daily chart, we are at the next level of support marked out since a few weeks ago. While we cannot be sure if it will bounce or break, we can still take this opportunity to prepare for further reopening since that is likely to come soon. As mentioned earlier, if you are still looking to accumulate, you can probably wait for an overreaction or severely oversold state before doing so.
STI – Updated Monthly Chart
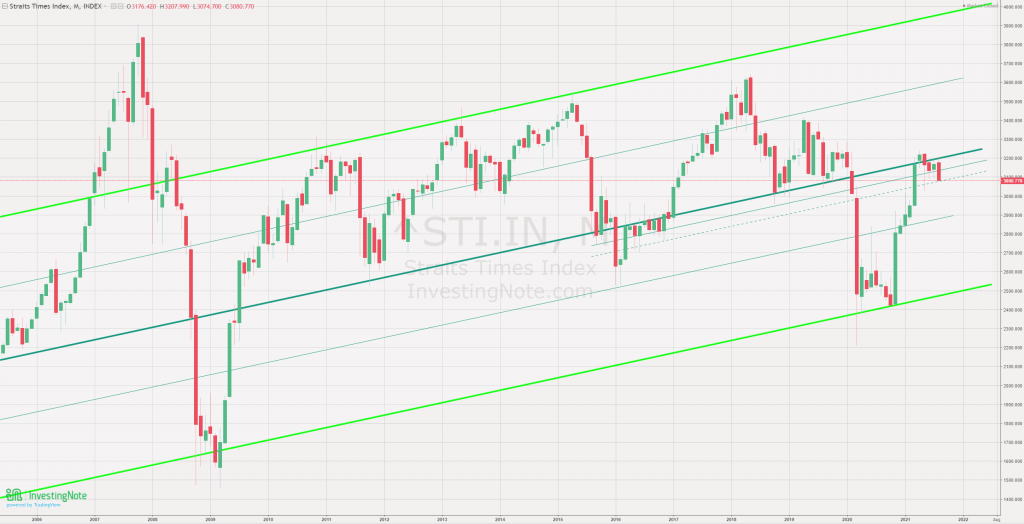
On the monthly chart, I have extended the minor support line with the dotted line. While we are seemingly heading southwards, I do not believe that the downside for the STI will be severe this time since we are still performing well and in the midst of recovery.
Author’s Call as of 28th August 2021
- STI weakened by Asian market decline and increase in community cases in Singapore
- STI back to second support level on the daily chart and seems to be holding for the week
- Monthly chart support level was lowered in view of the recent spike in cases in Singapore
- Advise against accumulation but buying back is still reasonable
Author’s Call as of 21st August 2021
- Market instability and uncertainty mounts but STI remains resilient for the moment because of our reopening plans
- 1H performance continues to outperform most analyst expectations although markets are not showing must positive price movements
- Weekly chart shows that STI is resting above 200 weeks movement average support level
- Start estimating potential upsides with significant risk will help determine if divestments are appropriate