Many investors know how to select their watchlists but are not sure when they should buy. In this post, I will be sharing some scenarios on when might be a good time to buy in with respect to market conditions. In essence, we are trying to spot and buy at a low to maximise profits when we sell.
Scenario 1 – Stable Market Conditions
Ironically, it is actually hardest to buy in when the economy is stable because the share prices are usually on a steady trajectory up or downwards. In such situations, share prices will climb continuously. Look at the sample chart below for a steady climb over a few years,
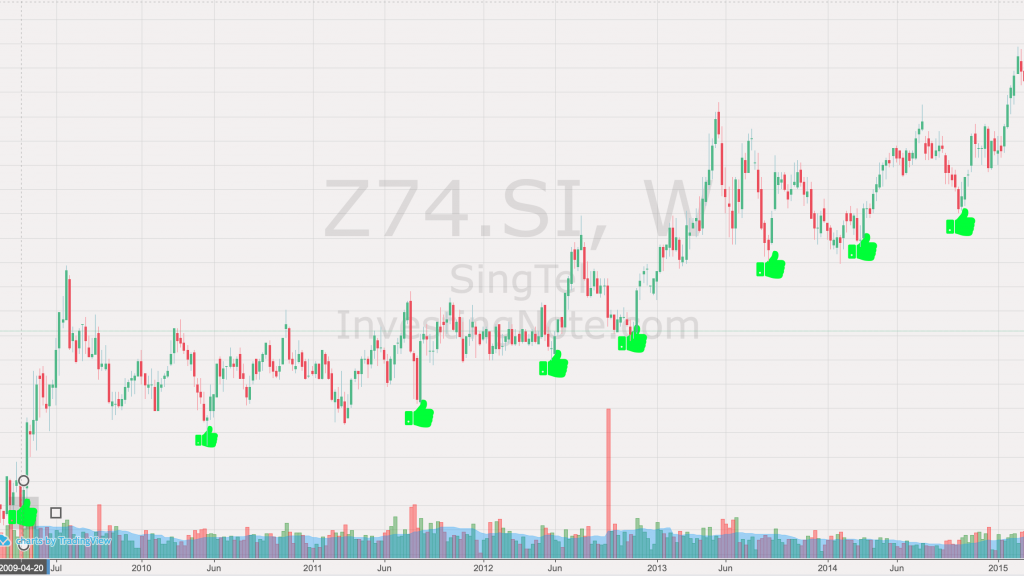
From the sample chart above, it is noticeable that there is a steady climb in share price for Singtel. In such a case, each “low” as shown on the chart (green thumbs up) are likely to get more expensive over time. Furthermore, that’s assuming that you manage to identify and bought those shares at those “lows.”
Scenario 2 – Long Term Consolidation
Some dividend shares are usually in a long term mode of consolidation because the company
- Maintains annual dividends (relatively high)
- Stagnation in business model
- Remains profitability and stable revenue

When the market is consolidating, do draw horizontal support and resistance lines to identify your buy and sell points. This lines will give you a good gauge on when to enter the market and buy your shares to maximise profits.
Scenario 3 – Poor economic outlook and/or political instability
During poor economic conditions or political instability, share prices of companies that are performing well will have many gaps between closing and opening between trading sessions. In such cases, you will have to
- Draw support and resistance lines
- Identify Multiple Entry Points (Label E1, E2, E3)
- Set aside capital for each entry point
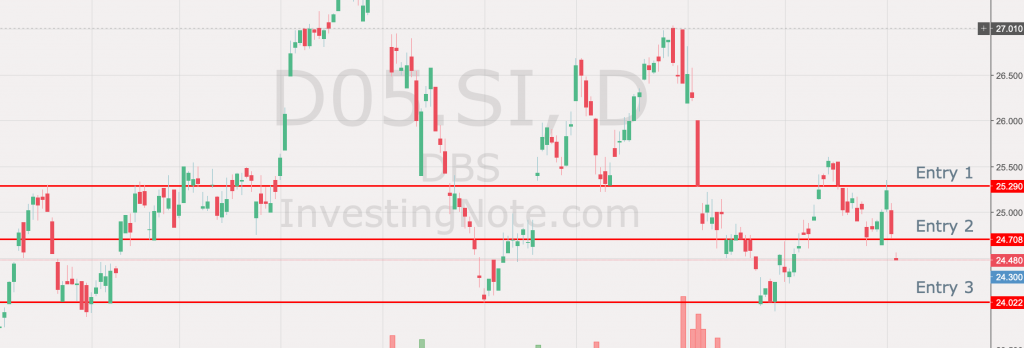
Amidst the trade war, it has been rather turbulent times for DBS shares as their price was fluctuating in the range of a few dollars (up to 11%) from peak to trough in the matter of days or weeks. In such case, with no near term recovery resolutions, you may follow the 3 steps above to find entry points. Additionally, do note that the smaller the price gap you set between entry points, the higher the risk.
Closing Thoughts
I am sure many people out there have different strategies to share with regards to identifying entry points. Hope this post have given you a better idea on when to buy and how to minimise risk or opportunity costs.