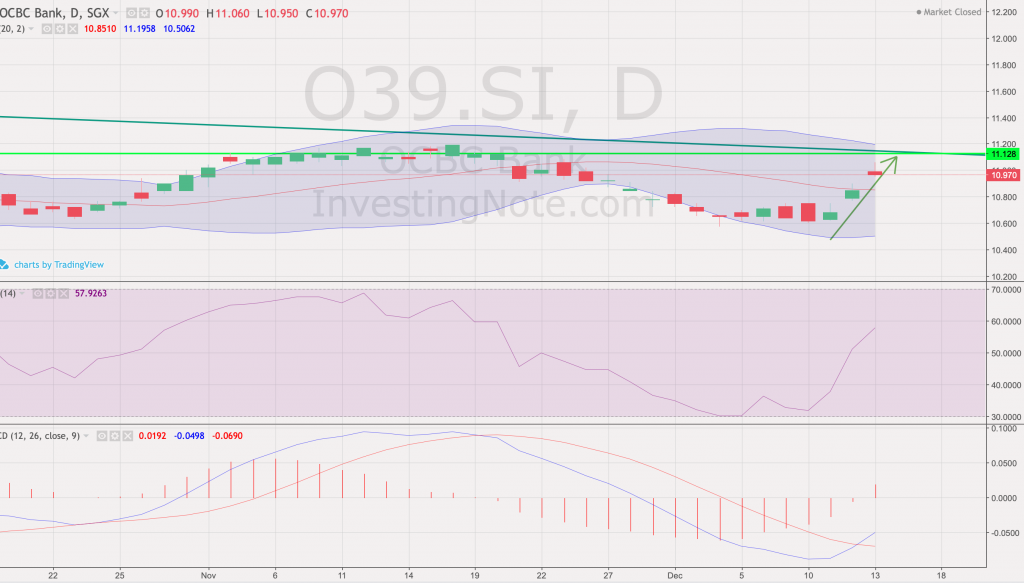
OCBC pulled back from its support line back to the resistance at $10.97 in anticipation of the trade deal between US and China. Well, the good news is that the pressure is off and the market is set to recover, which will be led by our Banks yet again. Kudos to our readers who held on rather selling on Friday at $11. As usual, what’s next and how high can OCBC climb towards for the rest of December?
Short term outlook (Daily Chart)

Following last week’s bounce, We are approaching the resistance on the daily chart at around $11.12. Depending on the volume on monday morning, we will be able to predict if the price can climb higher. do note that resistance does not mean limit as the price can possibility gap up above resistance at opening.
Near term Outlook (Weekly Chart)

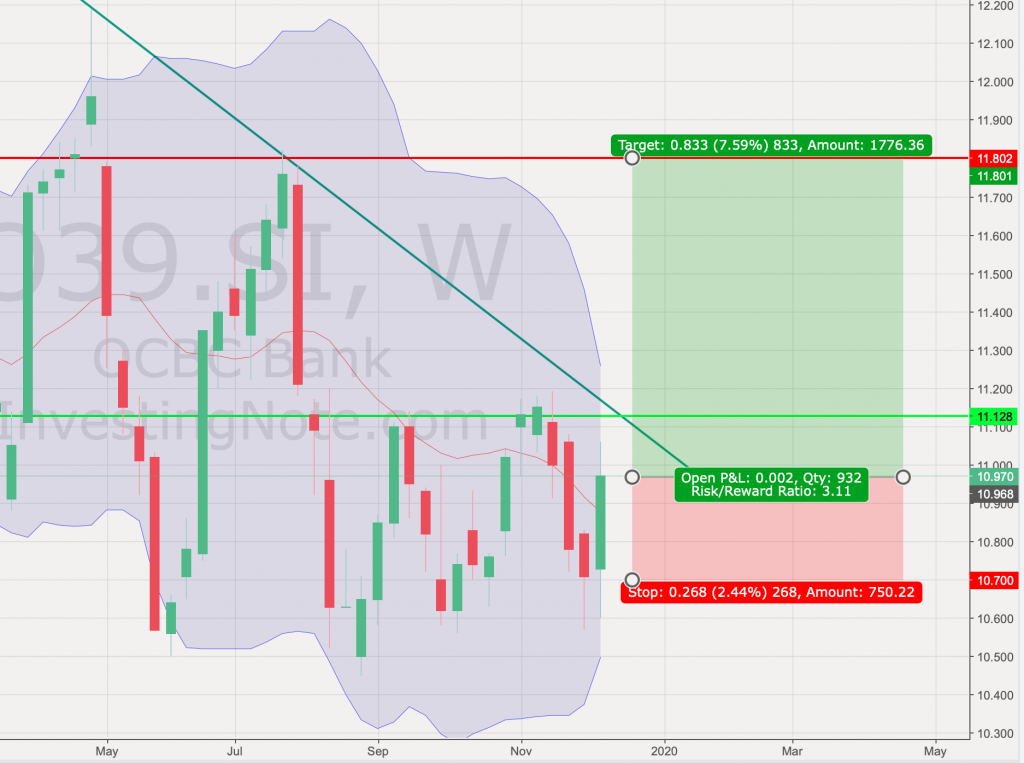
On the weekly chart, we can expect OCBC to see some up side all the way until the horizontal resistance if there are no further complications to US-China Trade. Reason being that tensions related to China has caused OCBC to trend lower due to its relationship with China. Since Hong Kong has mellowed down, we should be able to see some recovery from the counter in the coming weeks.
Author Call
- Bounce from 10.6 region has crossed 20 days MA resistance
- Heading towards 11.12 in the coming days then 11.8 (horizontal resistance)
- Potential upside for counter due to phase one of trade deal
- Tensions between China and HK has mellowed as protests are less violent
- Price likely to recover for the rest of the month
Author Call (As of 7 Dec)
- Support at 10.60 held and high volumes came in at 10.62 right before lunch time on 6 Dec
- OCBC 500 Million Debenture will help support its growth in the coming year
- Trump’s delay in trade deals with China will prolong consolidation (good for trading)
- Enter between 10.6 to 10.75 recommended
- Profit Taking targeted at around 11.1 to 11.2
Look out for future Training ideas and evaluations of Author calls (Click Here)


