Money is too cheap to be ignored – But there is no certainty that rally continues
The current situation has drawn a lot of attention from investors. Essentially, there is an underlying expectation that the market has not bottomed, as conditions around the world have not improved. Additionally, even if countries are back to Business As Usual, it does not mean that the economy will return to normalcy immediately. Hence many investors are still apprehensive about the current state of the economy.
On the other hand, there is no stopping when it comes to mindless greed. Thus I would not recommend to stay out entirely but rather to nibble cautiously at wider entry price gaps as the rally continues
STI – Updated Weekly Chart
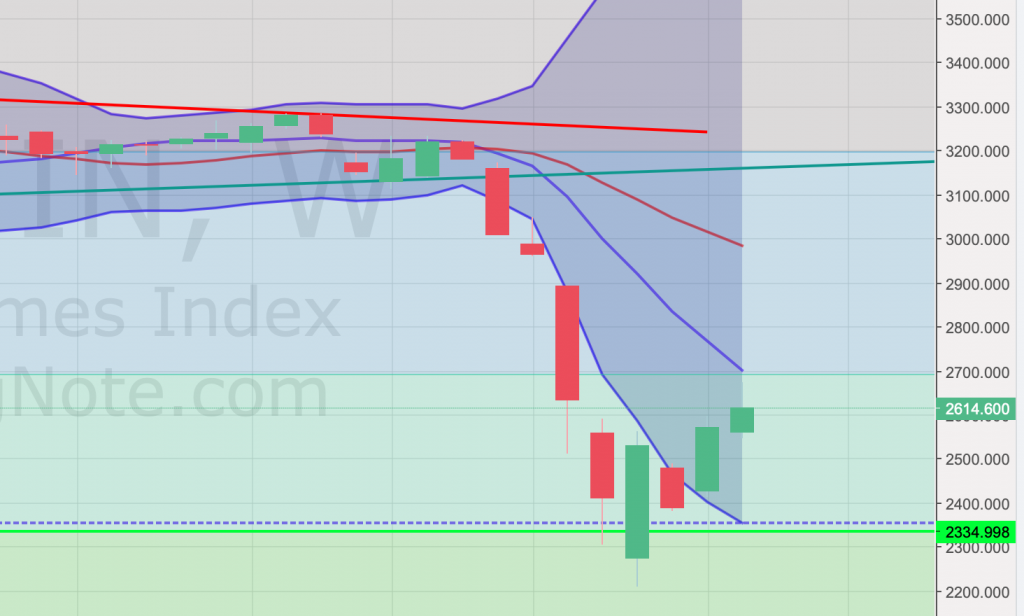
Evidently, the rally has not slowed down on the weekly chart. STI is still ascending with little to no sign of retreating on the weekly chart. At the current state, the next resistance at 2669 is crucial for STI to break before it continues to climb. In the past week, it did attempt to test the resistance but it was immediately stopped by significant amounts of profit-taking.
STI – Updated Monthly Chart
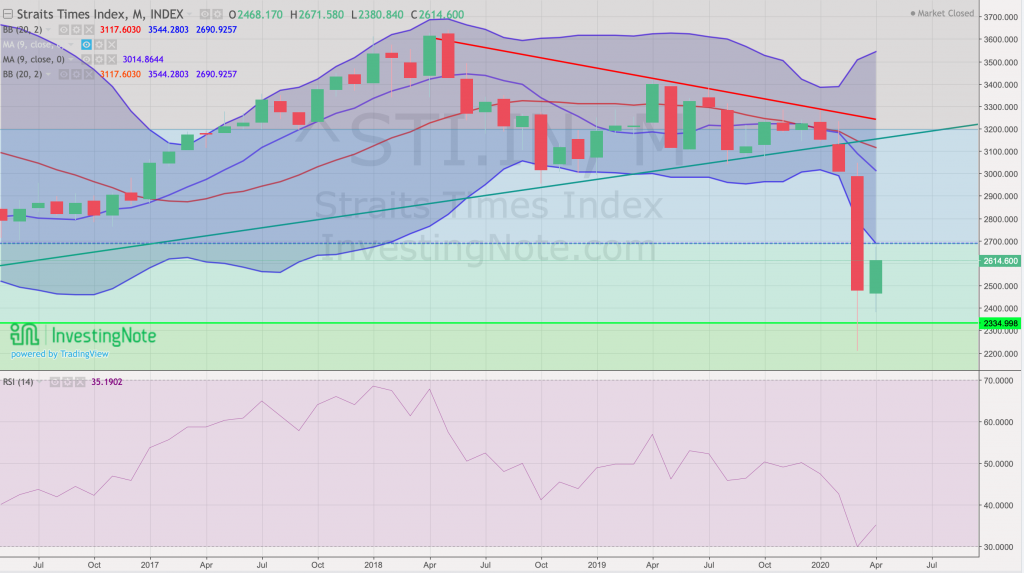
In the coming weeks, there will be more or less a confirmation of whether the rally will continue for subsequent weeks. At the moment there is still some distance from the lower bands of the Bollinger bands on the monthly chart.
Author’s Call as of 19 Apr 2020
- STI finished last week with a green candle stick showing continued rallying towards the fib resistance at 2669
- Currently monthly chart does not show any signs of the rally slowing down or ending prematurely
- No signs of markets recovering anytime soon though countries are announcing “good news” soon such as restarting the economy and number of infections peaking
- US indices finished on a high again on Friday thus there is no sudden dips expected for STI on Monday morning.
- Friday’s selling at near end of day was probably due to profit taking from cautious investors
Author’s Call as of 12 Apr 2020
- STI closed green for the weekly chart above Bollinger lower band but does not appear the same in the monthly chart
- RSI showed a small rebound above oversold territory
- If the rally continues it will have to pass 2667 which is unlikely at the moment
- At the moment there is little to celebrate because most countries are still locked down and are just peaking in the number of cases at best
- Accumulate with caution as there is little reason to expect that the market has bottomed