STI hit 3280 levels with a potential slow down
Last trading week ended with solid green candle and closed at 3280. This is consistent with the market outlook last week. Momentum might persist but seeing how US has hit 3330, there should be a correction happening soon. Previously, STI is suppose to have reached 3280 levels sooner but since now it hit 3280 at the brink of a correction, we will need to see how it goes in the coming week for more signals ahead.
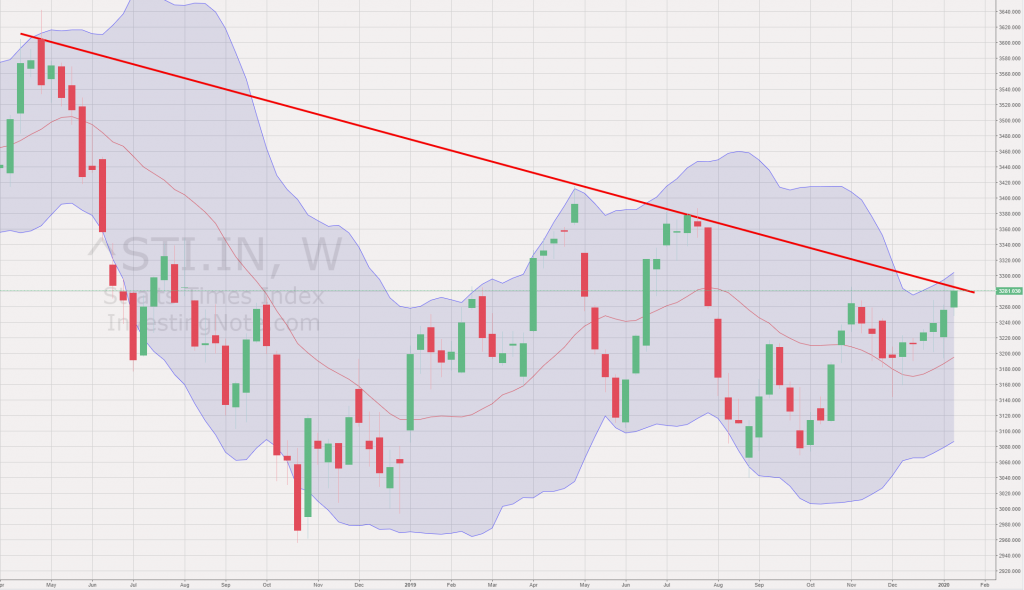
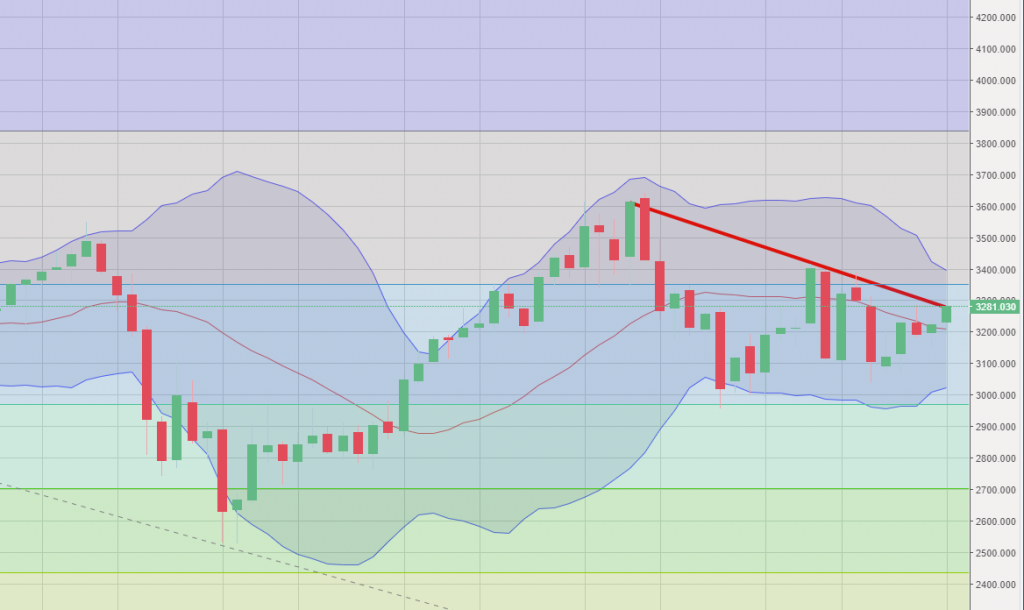
STI – Updated Weekly Chart

STI show slower momentum on the last trading day of the week. The resistance at 3280 is a downtrend resistance line formed since April of 2018.

The FIbo resistance at 3295 is the second resistance it has to break before it continues its uptrend. Should see some volatility in the coming weeks.
Author Call as of 19 Jan 2020
- STI hit resistance at 3280, (momentum slowed on Friday)
- US indices also showed a slower rally on Friday (brink of correction and profit taking)
- 1 more month to make Full year reporting and Feb 15 Budget 2020
- Market might have less attention during the CNY period
Author Call as of 12 Jan 2020
- STI will continue to head towards 3280 territory
- Minor breakout from weekly charts (to be confirmed in the coming week)
- STI CNY mood strikes and might lead to more aggressive buying
- SG Banks has shown some level of support for STI in the past week


